Installing the example application
With the controller installed, lets install an example application and make a canary deployment.
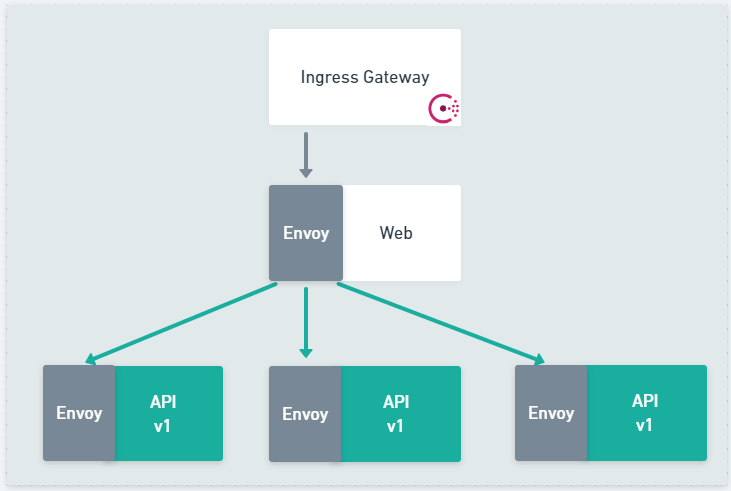
The example application is a simple two tier application, exposed by Consul Ingress Gateway. The single instance of the Web application communicates to the upstream API using Consul Service Mesh. All the metrics for the application are collected by Prometheus.
Default Consul config
Before you deploy the application it is important to ensure that you apply the Consul config CRDs that set the service type as HTTP and
configure the intentions allowing access between services. Consul release controller automatically creates much of the configuration
entries such as the ServiceRouter, ServiceResolver, and ServiceSplitter needed to control the flow of traffic to the application
but it does not create the ServiceIntentions or the ServiceDefaults.
To use the ServiceRouter, etc your service needs to be configured as a L7 aware HTTP or gRPC service. By defining these defaults, Consul
ensures that the necessary metrics emitted from the Envoy data plane are correctly configured to show detailed request level information
that Consul Release Controller uses to determine the health of your release.
Unlike most configuration that can be "hot reloaded" ServiceDefaults are only read at pod start time and must be applied before you
create the deployment.
Full listing for Consul configuration consul-config.yaml
---
apiVersion: consul.hashicorp.com/v1alpha1
kind: ServiceDefaults
metadata:
  name: web
spec:
  protocol: http

---
apiVersion: consul.hashicorp.com/v1alpha1
kind: ServiceDefaults
metadata:
  name: api
spec:
  protocol: http

---
apiVersion: consul.hashicorp.com/v1alpha1
kind: IngressGateway
metadata:
  name: ingress-gateway
spec:
  listeners:
    - port: 18080
      protocol: http
      services:
        - name: web
          hosts: ["*"]

---
apiVersion: consul.hashicorp.com/v1alpha1
kind: ServiceIntentions
metadata:
  name: ingress-gateway
spec:
  destination:
    name: ingress-gateway
  sources:
    - name: '*'
      action: allow

---
apiVersion: consul.hashicorp.com/v1alpha1
kind: ServiceIntentions
metadata:
  name: web
spec:
  destination:
    name: web
  sources:
    - name: ingress-gateway
      action: allow

---
apiVersion: consul.hashicorp.com/v1alpha1
kind: ServiceIntentions
metadata:
  name: api
spec:
  destination:
    name: api
  sources:
    - name: web
      action: allow
Let's deploy the application, you can either, run the example direct from the examples in the GitHub repository or you can
clone the repository github.com/nicholasjackson/consul-release-controller and run the files locally.
For convenience, this example will use the files direct from GitHub.
kubectl apply \
-f https://raw.githubusercontent.com/nicholasjackson/consul-release-controller/main/example/kubernetes/consul-config.yaml
If successful you should see output like the following:
servicedefaults.consul.hashicorp.com/web created
servicedefaults.consul.hashicorp.com/api created
ingressgateway.consul.hashicorp.com/ingress-gateway created
serviceintentions.consul.hashicorp.com/ingress-gateway created
serviceintentions.consul.hashicorp.com/web created
serviceintentions.consul.hashicorp.com/api created
Let's now deploy the first part of the application Web.
Deploying Web
The Web application uses Fake Service, an example microservice application that can be configured to call upstream services and simulate various performance criteria.
Full listing for Web Kubernetes deployment web.yaml
---
apiVersion: v1
kind: Service
metadata:
  name: web
  labels:
    app: metrics
spec:
  selector:
    app: web
  ports:
    - name: http
      protocol: TCP
      port: 9090
      targetPort: 9090
    - name: metrics # prom scraping port
      protocol: TCP
      port: 20200
      targetPort: 20200

---
apiVersion: v1
kind: ServiceAccount
metadata:
  name: web
automountServiceAccountToken: false

---
apiVersion: apps/v1
kind: Deployment
metadata:
  name: web-deployment
  labels:
    app: web_v1
spec:
  replicas: 1
  selector:
    matchLabels:
      app: web
  template:
    metadata:
      labels:
        app: web
        metrics: enabled
      annotations:
        consul.hashicorp.com/connect-inject: 'true'
        consul.hashicorp.com/connect-service-upstreams: 'api:9091'
        #consul.hashicorp.com/transparent-proxy: 'true'
        #consul.hashicorp.com/transparent-proxy-overwrite-probes: 'true'
        #consul.hashicorp.com/transparent-proxy-exclude-inbound-ports: '9090'
    spec:
      serviceAccountName: web
      automountServiceAccountToken: true
      containers:
        - name: web
          image: nicholasjackson/fake-service:v0.23.1
          imagePullPolicy: IfNotPresent
          ports:
            - containerPort: 9090
          env:
            - name: "NAME"
              value: "WEB"
            - name: "LISTEN_ADDR"
              value: "0.0.0.0:9090"
            - name: "UPSTREAM_URIS"
              value: "http://localhost:9091"
            - name: "TIMING_50_PERCENTILE"
              value: "10ms"
            - name: "TRACING_ZIPKIN"
              value: "http://tempo:9411"
            - name: "READY_CHECK_RESPONSE_DELAY"
              value: "10s"
          readinessProbe:
            httpGet:
              path: /ready
              port: 9090
            periodSeconds: 5
            initialDelaySeconds: 5
          livenessProbe:
            httpGet:
              path: /health
              port: 9090
            periodSeconds: 5
            initialDelaySeconds: 5
Let's deploy the application, using the files direct from GitHub.
kubectl apply \
-f https://raw.githubusercontent.com/nicholasjackson/consul-release-controller/main/example/kubernetes/web.yaml
If successful you should see output like the following:
service/web created
serviceaccount/web created
deployment.apps/web-deployment created
You should also see the pod running in Kubernetes:
➜ kubectl get pods
NAME                              READY   STATUS    RESTARTS   AGE
web-deployment-575887cd4c-ckd8k   2/2     Running   0          4m35s
Deploying the API
Now that web is running let's deploy the API service, API will be the service that we are going to perform the canary deployment with.
Full listing for API Kubernetes deployment api.yaml
---
apiVersion: v1
kind: Service
metadata:
  name: api
  namespace: default
  labels:
    app: metrics
spec:
  selector:
    app: api
  ports:
    - name: http
      protocol: TCP
      port: 9090
      targetPort: 9090
    - name: metrics # prom scraping port
      protocol: TCP
      port: 20200
      targetPort: 20200

---
apiVersion: v1
kind: ServiceAccount
metadata:
  name: api
  namespace: default
automountServiceAccountToken: false

---
apiVersion: apps/v1
kind: Deployment
metadata:
  name: api-deployment
  namespace: default
  labels:
    app: api_v1
spec:
  replicas: 3
  selector:
    matchLabels:
      app: api
  template:
    metadata:
      labels:
        app: api
        metrics: enabled
      annotations:
        consul.hashicorp.com/connect-inject: 'true'
        #consul.hashicorp.com/transparent-proxy: 'true'
        #consul.hashicorp.com/transparent-proxy-overwrite-probes: 'true'
    spec:
      serviceAccountName: api
      automountServiceAccountToken: true
      containers:
        - name: api
          image: nicholasjackson/fake-service:v0.23.1
          imagePullPolicy: IfNotPresent
          ports:
            - containerPort: 9090
          env:
            - name: "NAME"
              value: "API V1"
            - name: "LISTEN_ADDR"
              value: "0.0.0.0:9090"
            - name: "TIMING_50_PERCENTILE"
              value: "10ms"
            - name: "TRACING_ZIPKIN"
              value: "http://tempo:9411"
            - name: "READY_CHECK_RESPONSE_DELAY"
              value: "10s"
          readinessProbe:
            httpGet:
              path: /ready
              port: 9090
            periodSeconds: 5
            initialDelaySeconds: 5
          livenessProbe:
            httpGet:
              path: /health
              port: 9090
            periodSeconds: 5
            initialDelaySeconds: 5
As you did with the Web application, let's create the deployment and service for the API.
kubectl apply \
-f https://raw.githubusercontent.com/nicholasjackson/consul-release-controller/main/example/kubernetes/api.yaml
If successful you should see output like the following:
service/web created
serviceaccount/web created
deployment.apps/web-deployment created
When you run the kubectl get pods command this time you should see the single web pod and three API pods.
➜ kubectl get pods
NAME                              READY   STATUS    RESTARTS   AGE
web-deployment-575887cd4c-ckd8k   2/2     Running   0          10m
api-deployment-54dc89bcc9-8sdr5   2/2     Running   0          7s
api-deployment-54dc89bcc9-9dflf   2/2     Running   0          7s
api-deployment-54dc89bcc9-9rg59   2/2     Running   0          7s
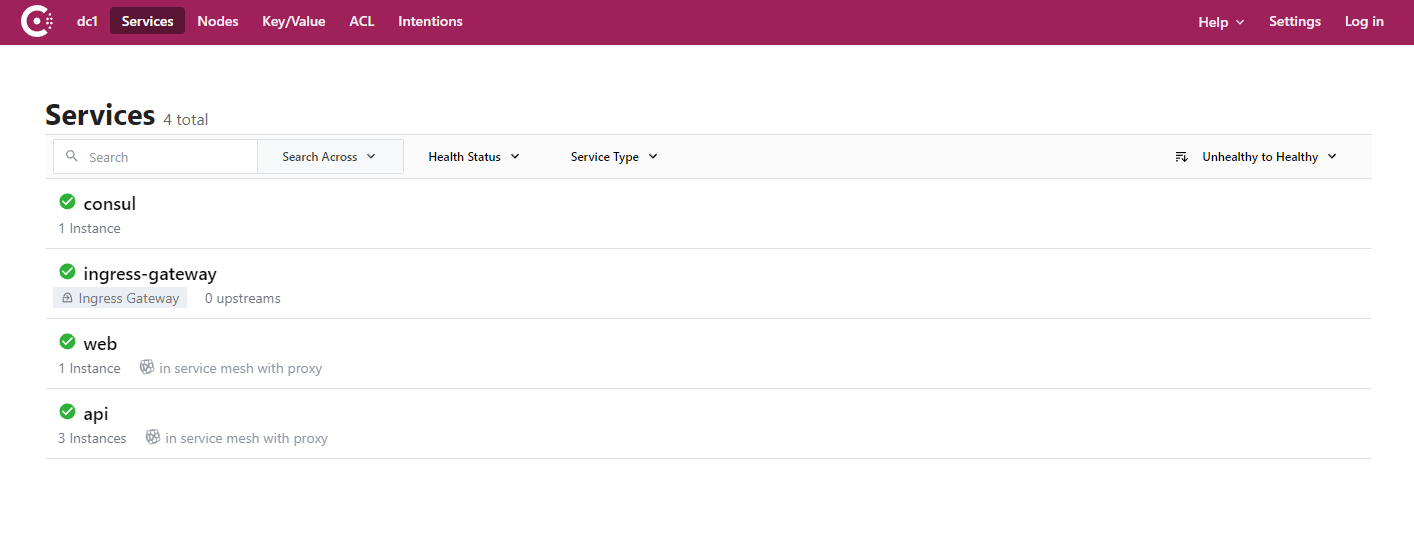
These will also be visible in the Consul UI.
Testing the example application
Now that the example has been deployed, let's test that it is working correctly.
To access the application, let's use kubectl port-forward to expose the Kubernetes web service to the local machine.
kubectl port-forward svc/web 29090:9090
You should see output from kubectl that looks like the following:
Forwarding from 127.0.0.1:29090 -> 9090
Forwarding from [::1]:29090 -> 9090
You can test the application is working by using cURL in another terminal, run the following command:
curl http://localhost:29090
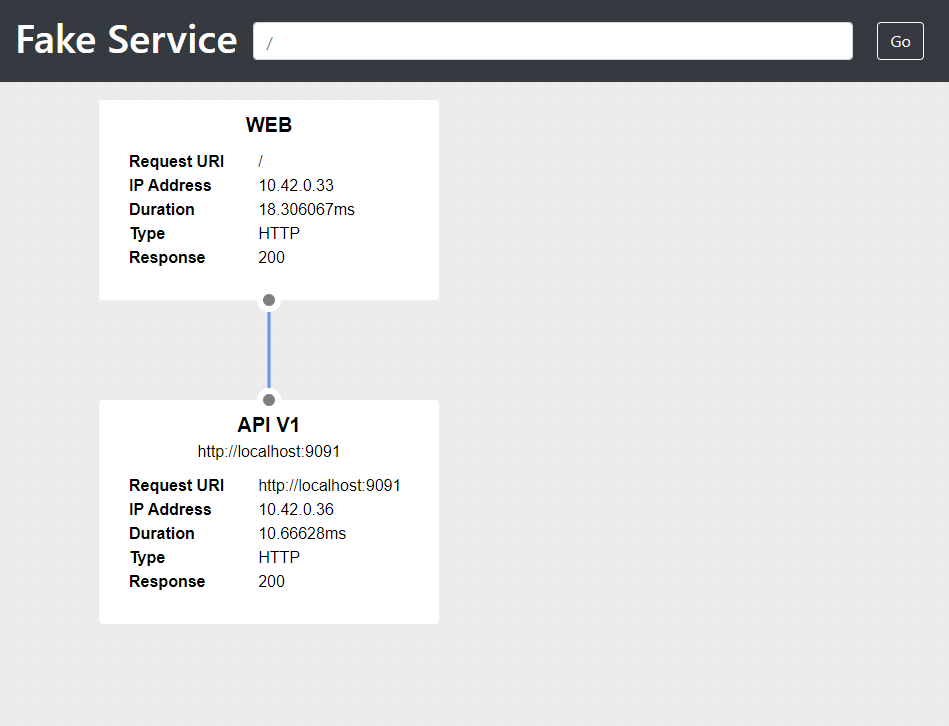
Fake Service produces a detailed JSON payload echoing the details of your request, it also shows the details of any
upstream calls that it made. If the application is working correctly you will see the upstream_calls section that show
the response from the upstream API service.
{
  "name": "WEB",
  "uri": "/",
  "type": "HTTP",
  "ip_addresses": [
    "10.42.0.33"
  ],
  "start_time": "2022-02-22T13:38:47.026571",
  "end_time": "2022-02-22T13:38:47.039223",
  "duration": "12.6529ms",
  "body": "Hello World",
  "upstream_calls": {
    "http://localhost:9091": {
      "name": "API V1",
      "uri": "http://localhost:9091",
      "type": "HTTP",
      "ip_addresses": [
        "10.42.0.35"
      ],
      "start_time": "2022-02-22T13:38:47.028300",
      "end_time": "2022-02-22T13:38:47.038551",
      "duration": "10.250688ms",
      "headers": {
        "Content-Length": "256",
        "Content-Type": "text/plain; charset=utf-8",
        "Date": "Tue, 22 Feb 2022 13:38:47 GMT",
        "Server": "envoy",
        "X-Envoy-Upstream-Service-Time": "11"
      },
      "body": "Hello World",
      "code": 200
    }
  },
  "code": 200
}
If you prefer, you can also open the Fake Service UI in your browser http://localhost:29090
Configuring metrics collection
The release controller queries Prometheus to determine the health of your application,
can be configured to scrape the services by creating ServiceMonitor CRDs, if you have prometheus installed
to your cluster using the prometheus operator in the monitoring namespace then you can use the example
ServiceMonitor configuration listed below.
Full listing for deployment metrics.yaml
---
apiVersion: monitoring.coreos.com/v1
kind: ServiceMonitor
metadata:
  labels:
    release: prometheus
  name: example-app
  namespace: monitoring
spec:
  endpoints:
  - interval: 15s
    port: metrics
  jobLabel: example-app
  namespaceSelector:
    matchNames:
    - default
  selector:
    matchLabels:
      app: metrics
If you have a different setup then you need to ensure that the metrics port 20200 for both the Web and API Kubernetes services are scraped by prometheus.
Let's apply this configuration:
kubectl apply \
-f https://raw.githubusercontent.com/nicholasjackson/consul-release-controller/main/example/kubernetes/metrics.yaml
Just before we get into creating the new release, let's add a dashboard and some automated traffic to the service.
Adding the example Grafana Dashboard
To visualize the traffic flow in the example application, you can deploy the example dashboard. The file
application-dashboard.yaml in the examples directory uses the Grafana controller installed by the Grafana
Helm chart that inspects ConfigMap resources in the same namespace where the Grafana install is and automatically
loads the dashboard json into Grafana.
---
apiVersion: v1
kind: ConfigMap
metadata:
  name: application-dashboard
  namespace: monitoring
  labels:
     grafana_dashboard: "1"
data:
  api.json: |
Full listing for API Kubernetes deployment application-dashboard.yaml
---
apiVersion: v1
kind: ConfigMap
metadata:
name: application-dashboard
namespace: monitoring
labels:
grafana_dashboard: "1"
data:
api.json: |
{
"annotations": {
"list": [
{
"builtIn": 1,
"datasource": "-- Grafana --",
"enable": true,
"hide": true,
"iconColor": "rgba(0, 211, 255, 1)",
"name": "Annotations & Alerts",
"target": {
"limit": 100,
"matchAny": false,
"tags": [],
"type": "dashboard"
},
"type": "dashboard"
},
{
"datasource": "Prometheus",
"enable": true,
"expr": "consul_release_controller_state_changed_start_seconds{release=\"api\",state!=\"state_idle\"}",
"iconColor": "red",
"name": "State Change",
"step": "",
"tagKeys": "state",
"titleFormat": "state"
}
]
},
"editable": true,
"fiscalYearStartMonth": 0,
"gnetId": null,
"graphTooltip": 0,
"links": [],
"liveNow": false,
"panels": [
{
"datasource": null,
"description": "",
"fieldConfig": {
"defaults": {
"color": {
"mode": "thresholds"
},
"mappings": [],
"noValue": "0",
"thresholds": {
"mode": "absolute",
"steps": [
{
"color": "blue",
"value": null
},
{
"color": "red",
"value": 80
}
]
}
},
"overrides": []
},
"gridPos": {
"h": 8,
"w": 8,
"x": 0,
"y": 0
},
"id": 14,
"options": {
"colorMode": "background",
"graphMode": "none",
"justifyMode": "auto",
"orientation": "auto",
"reduceOptions": {
"calcs": [
"lastNotNull"
],
"fields": "",
"values": false
},
"text": {},
"textMode": "auto"
},
"pluginVersion": "8.2.3",
"targets": [
{
"exemplar": true,
"expr": "count(count(prober_probe_total{pod=~\"web-deployment-.*\", container=\"web\", result=\"successful\", probe_type=\"Liveness\"}) by (pod))",
"interval": "",
"legendFormat": "",
"refId": "A"
}
],
"title": "Web Pods Running",
"type": "stat"
},
{
"datasource": null,
"description": "",
"fieldConfig": {
"defaults": {
"color": {
"mode": "thresholds"
},
"mappings": [],
"noValue": "0",
"thresholds": {
"mode": "absolute",
"steps": [
{
"color": "green",
"value": null
},
{
"color": "red",
"value": 80
}
]
}
},
"overrides": []
},
"gridPos": {
"h": 8,
"w": 8,
"x": 8,
"y": 0
},
"id": 15,
"options": {
"colorMode": "background",
"graphMode": "none",
"justifyMode": "auto",
"orientation": "auto",
"reduceOptions": {
"calcs": [
"last"
],
"fields": "",
"values": false
},
"text": {},
"textMode": "auto"
},
"pluginVersion": "8.2.3",
"targets": [
{
"exemplar": true,
"expr": "count(count(prober_probe_total{pod=~\"api-deployment-primary-.*\", container=\"api\", result=\"successful\", probe_type=\"Liveness\"}) by (pod))",
"interval": "",
"legendFormat": "",
"refId": "A"
}
],
"title": "API Primary Pods Running",
"type": "stat"
},
{
"datasource": null,
"description": "",
"fieldConfig": {
"defaults": {
"color": {
"mode": "thresholds"
},
"mappings": [],
"noValue": "0",
"thresholds": {
"mode": "absolute",
"steps": [
{
"color": "yellow",
"value": null
},
{
"color": "red",
"value": 80
}
]
}
},
"overrides": []
},
"gridPos": {
"h": 8,
"w": 8,
"x": 16,
"y": 0
},
"id": 16,
"options": {
"colorMode": "background",
"graphMode": "none",
"justifyMode": "center",
"orientation": "auto",
"reduceOptions": {
"calcs": [
"last"
],
"fields": "",
"values": false
},
"text": {},
"textMode": "auto"
},
"pluginVersion": "8.2.3",
"targets": [
{
"exemplar": true,
"expr": "count(count(prober_probe_total{pod!~\"api-deployment-primary-.*\", container=\"api\", result=\"successful\", probe_type=\"Liveness\"}) by (pod))",
"interval": "",
"legendFormat": "",
"refId": "A"
}
],
"title": "API Canary Pods Running",
"type": "stat"
},
{
"datasource": null,
"description": "",
"fieldConfig": {
"defaults": {
"color": {
"mode": "palette-classic"
},
"custom": {
"axisLabel": "",
"axisPlacement": "auto",
"axisSoftMin": 2,
"barAlignment": 0,
"drawStyle": "line",
"fillOpacity": 10,
"gradientMode": "none",
"hideFrom": {
"legend": false,
"tooltip": false,
"viz": false
},
"lineInterpolation": "linear",
"lineWidth": 1,
"pointSize": 5,
"scaleDistribution": {
"type": "linear"
},
"showPoints": "never",
"spanNulls": false,
"stacking": {
"group": "A",
"mode": "none"
},
"thresholdsStyle": {
"mode": "off"
}
},
"mappings": [],
"thresholds": {
"mode": "absolute",
"steps": [
{
"color": "green",
"value": null
},
{
"color": "red",
"value": 80
}
]
},
"unit": "short"
},
"overrides": []
},
"gridPos": {
"h": 10,
"w": 17,
"x": 0,
"y": 8
},
"id": 2,
"options": {
"legend": {
"calcs": [
"lastNotNull",
"sum"
],
"displayMode": "table",
"placement": "bottom"
},
"tooltip": {
"mode": "single"
}
},
"pluginVersion": "8.2.3",
"targets": [
{
"exemplar": true,
"expr": "sum(rate(envoy_http_18080_downstream_rq_xx{pod=~\"consul-ingress-gateway.*\", envoy_response_code_class=~\"2|5\"}[$__rate_interval])) by (envoy_response_code_class)",
"hide": false,
"interval": "",
"legendFormat": "Downstream Response Code {{envoy_response_code_class}}xx",
"refId": "A"
},
{
"exemplar": true,
"expr": "sum(rate(envoy_cluster_external_upstream_rq{consul_source_service=\"web\",consul_destination_service=\"api\"}[$__rate_interval])) by (envoy_response_code)",
"hide": false,
"interval": "",
"legendFormat": "API Upstream Response Code {{envoy_response_code}}",
"refId": "B"
}
],
"timeFrom": null,
"timeShift": null,
"title": "Web Response",
"type": "timeseries"
},
{
"datasource": null,
"description": "",
"fieldConfig": {
"defaults": {
"mappings": [],
"max": 1,
"noValue": "0",
"thresholds": {
"mode": "absolute",
"steps": [
{
"color": "green",
"value": null
},
{
"color": "red",
"value": 0
}
]
}
},
"overrides": []
},
"gridPos": {
"h": 10,
"w": 7,
"x": 17,
"y": 8
},
"id": 11,
"options": {
"orientation": "auto",
"reduceOptions": {
"calcs": [
"sum"
],
"fields": "",
"values": false
},
"showThresholdLabels": false,
"showThresholdMarkers": true,
"text": {}
},
"pluginVersion": "8.2.3",
"targets": [
{
"exemplar": true,
"expr": "sum(round(increase(envoy_http_18080_downstream_rq_xx{pod=~\"consul-ingress-gateway.*\", envoy_response_code_class=\"5\"}[$__rate_interval]),1))",
"interval": "",
"legendFormat": "",
"refId": "A"
}
],
"timeFrom": null,
"timeShift": null,
"title": "Downstream error count",
"type": "gauge"
},
{
"datasource": null,
"fieldConfig": {
"defaults": {
"color": {
"mode": "palette-classic"
},
"custom": {
"axisLabel": "",
"axisPlacement": "auto",
"barAlignment": 0,
"drawStyle": "line",
"fillOpacity": 10,
"gradientMode": "none",
"hideFrom": {
"legend": false,
"tooltip": false,
"viz": false
},
"lineInterpolation": "linear",
"lineWidth": 1,
"pointSize": 5,
"scaleDistribution": {
"type": "linear"
},
"showPoints": "never",
"spanNulls": true,
"stacking": {
"group": "A",
"mode": "none"
},
"thresholdsStyle": {
"mode": "off"
}
},
"mappings": [],
"min": 0,
"thresholds": {
"mode": "absolute",
"steps": [
{
"color": "green",
"value": null
},
{
"color": "red",
"value": 80
}
]
},
"unit": "short"
},
"overrides": [
{
"matcher": {
"id": "byName",
"options": "Primary - 200"
},
"properties": [
{
"id": "color",
"value": {
"fixedColor": "#73BF69",
"mode": "fixed"
}
}
]
},
{
"matcher": {
"id": "byName",
"options": "Canary - 200"
},
"properties": [
{
"id": "color",
"value": {
"fixedColor": "#FADE2A",
"mode": "fixed"
}
}
]
}
]
},
"gridPos": {
"h": 11,
"w": 17,
"x": 0,
"y": 18
},
"id": 4,
"options": {
"legend": {
"calcs": [
"mean",
"lastNotNull",
"max",
"min",
"sum"
],
"displayMode": "table",
"placement": "bottom"
},
"tooltip": {
"mode": "single"
}
},
"pluginVersion": "8.2.3",
"targets": [
{
"exemplar": true,
"expr": "sum by (envoy_response_code) (rate(envoy_cluster_upstream_rq{pod!~\"api-deployment-primary.*\", namespace=\"default\", envoy_cluster_name=\"local_app\", pod=~\"api.*\"}[$__rate_interval]))",
"interval": "",
"legendFormat": "Canary - {{envoy_response_code}}",
"refId": "A"
},
{
"exemplar": true,
"expr": "sum by (envoy_response_code) (rate(envoy_cluster_upstream_rq{pod=~\"api-deployment-primary.*\", namespace=\"default\", envoy_cluster_name=\"local_app\", pod=~\"api.*\"}[$__rate_interval]))",
"interval": "",
"legendFormat": "Primary - {{envoy_response_code}}",
"refId": "B"
}
],
"timeFrom": null,
"timeShift": null,
"title": "API Request per Second",
"type": "timeseries"
},
{
"datasource": null,
"fieldConfig": {
"defaults": {
"mappings": [],
"noValue": "0",
"thresholds": {
"mode": "absolute",
"steps": [
{
"color": "green",
"value": null
},
{
"color": "red",
"value": 1
}
]
}
},
"overrides": []
},
"gridPos": {
"h": 11,
"w": 7,
"x": 17,
"y": 18
},
"id": 6,
"options": {
"orientation": "auto",
"reduceOptions": {
"calcs": [
"lastNotNull"
],
"fields": "",
"values": false
},
"showThresholdLabels": false,
"showThresholdMarkers": true,
"text": {}
},
"pluginVersion": "8.2.3",
"targets": [
{
"exemplar": true,
"expr": "sum(round(increase(envoy_cluster_upstream_rq_retry{consul_destination_service=\"api\"}[$__rate_interval]),1))",
"interval": "",
"legendFormat": "",
"refId": "A"
}
],
"timeFrom": null,
"timeShift": null,
"title": "Retries per Second",
"type": "gauge"
},
{
"datasource": null,
"fieldConfig": {
"defaults": {
"color": {
"mode": "palette-classic"
},
"custom": {
"axisLabel": "",
"axisPlacement": "auto",
"barAlignment": 0,
"drawStyle": "line",
"fillOpacity": 10,
"gradientMode": "none",
"hideFrom": {
"legend": false,
"tooltip": false,
"viz": false
},
"lineInterpolation": "linear",
"lineStyle": {
"fill": "solid"
},
"lineWidth": 1,
"pointSize": 5,
"scaleDistribution": {
"type": "linear"
},
"showPoints": "auto",
"spanNulls": false,
"stacking": {
"group": "A",
"mode": "normal"
},
"thresholdsStyle": {
"mode": "off"
}
},
"mappings": [],
"min": 0,
"thresholds": {
"mode": "absolute",
"steps": [
{
"color": "green",
"value": null
},
{
"color": "red",
"value": 80
}
]
},
"unit": "short"
},
"overrides": [
{
"matcher": {
"id": "byName",
"options": "Web Pods"
},
"properties": [
{
"id": "color",
"value": {
"fixedColor": "blue",
"mode": "fixed"
}
}
]
},
{
"matcher": {
"id": "byName",
"options": "API Canary Pods"
},
"properties": [
{
"id": "color",
"value": {
"fixedColor": "#FADE2A",
"mode": "fixed"
}
}
]
},
{
"matcher": {
"id": "byName",
"options": "API Primary Pods"
},
"properties": [
{
"id": "color",
"value": {
"fixedColor": "green",
"mode": "fixed"
}
}
]
}
]
},
"gridPos": {
"h": 11,
"w": 17,
"x": 0,
"y": 29
},
"id": 17,
"options": {
"legend": {
"calcs": [
"mean",
"lastNotNull",
"max",
"min",
"sum"
],
"displayMode": "table",
"placement": "bottom"
},
"tooltip": {
"mode": "single"
}
},
"pluginVersion": "8.2.3",
"targets": [
{
"exemplar": true,
"expr": "count(count(prober_probe_total{pod=~\"web-deployment-.*\", container=\"web\", result=\"successful\", probe_type=\"Liveness\"}) by (pod))",
"interval": "",
"legendFormat": "Web Pods",
"refId": "A"
},
{
"exemplar": true,
"expr": "count(prober_probe_total{pod!~\"api-deployment-primary-.*\", container=\"api\", result=\"successful\", probe_type=\"Liveness\"})",
"interval": "",
"legendFormat": "API Canary Pods",
"refId": "B"
},
{
"exemplar": true,
"expr": "count(prober_probe_total{pod=~\"api-deployment-primary-.*\", container=\"api\", result=\"successful\", probe_type=\"Liveness\"})",
"hide": false,
"interval": "",
"legendFormat": "API Primary Pods",
"refId": "C"
}
],
"timeFrom": null,
"timeShift": null,
"title": "Running Pods",
"type": "timeseries"
},
{
"datasource": null,
"fieldConfig": {
"defaults": {
"mappings": [],
"noValue": "0",
"thresholds": {
"mode": "absolute",
"steps": [
{
"color": "green",
"value": null
},
{
"color": "red",
"value": 1
}
]
}
},
"overrides": []
},
"gridPos": {
"h": 11,
"w": 7,
"x": 17,
"y": 29
},
"id": 18,
"options": {
"orientation": "auto",
"reduceOptions": {
"calcs": [
"lastNotNull"
],
"fields": "",
"values": false
},
"showThresholdLabels": false,
"showThresholdMarkers": true,
"text": {}
},
"pluginVersion": "8.2.3",
"targets": [
{
"exemplar": true,
"expr": "sum(envoy_cluster_outlier_detection_ejections_active{consul_destination_service=\"api\"})",
"interval": "",
"legendFormat": "",
"refId": "A"
}
],
"timeFrom": null,
"timeShift": null,
"title": "API Outlier Ejection",
"type": "gauge"
},
{
"datasource": "Loki",
"gridPos": {
"h": 10,
"w": 24,
"x": 0,
"y": 40
},
"id": 10,
"options": {
"dedupStrategy": "none",
"enableLogDetails": true,
"prettifyLogMessage": false,
"showCommonLabels": false,
"showLabels": false,
"showTime": false,
"sortOrder": "Descending",
"wrapLogMessage": false
},
"targets": [
{
"expr": "{app=\"web\"}",
"refId": "A"
}
],
"title": "Web Logs",
"type": "logs"
},
{
"datasource": "Loki",
"gridPos": {
"h": 10,
"w": 24,
"x": 0,
"y": 50
},
"id": 12,
"options": {
"dedupStrategy": "none",
"enableLogDetails": true,
"prettifyLogMessage": false,
"showCommonLabels": false,
"showLabels": false,
"showTime": false,
"sortOrder": "Descending",
"wrapLogMessage": false
},
"targets": [
{
"expr": "{app=~\"api.*\"}",
"refId": "A"
}
],
"title": "API Logs",
"type": "logs"
}
],
"refresh": "10s",
"schemaVersion": 31,
"style": "dark",
"tags": [],
"templating": {
"list": []
},
"time": {
"from": "now-5m",
"to": "now"
},
"timepicker": {},
"timezone": "",
"title": "Application Dashboard",
"uid": "sdfsdfsdf",
"version": 1
}
This tutorial assumes that you have setup your cluster as defined in the prerequisites so we can apply this configuration direct from the example repo:
kubectl apply \
-f https://raw.githubusercontent.com/nicholasjackson/consul-release-controller/main/example/kubernetes/metrics.yaml
If you are not using this feature on your cluster you can manually add the JSON by using Grafana's Import dashboard feature in the UI.
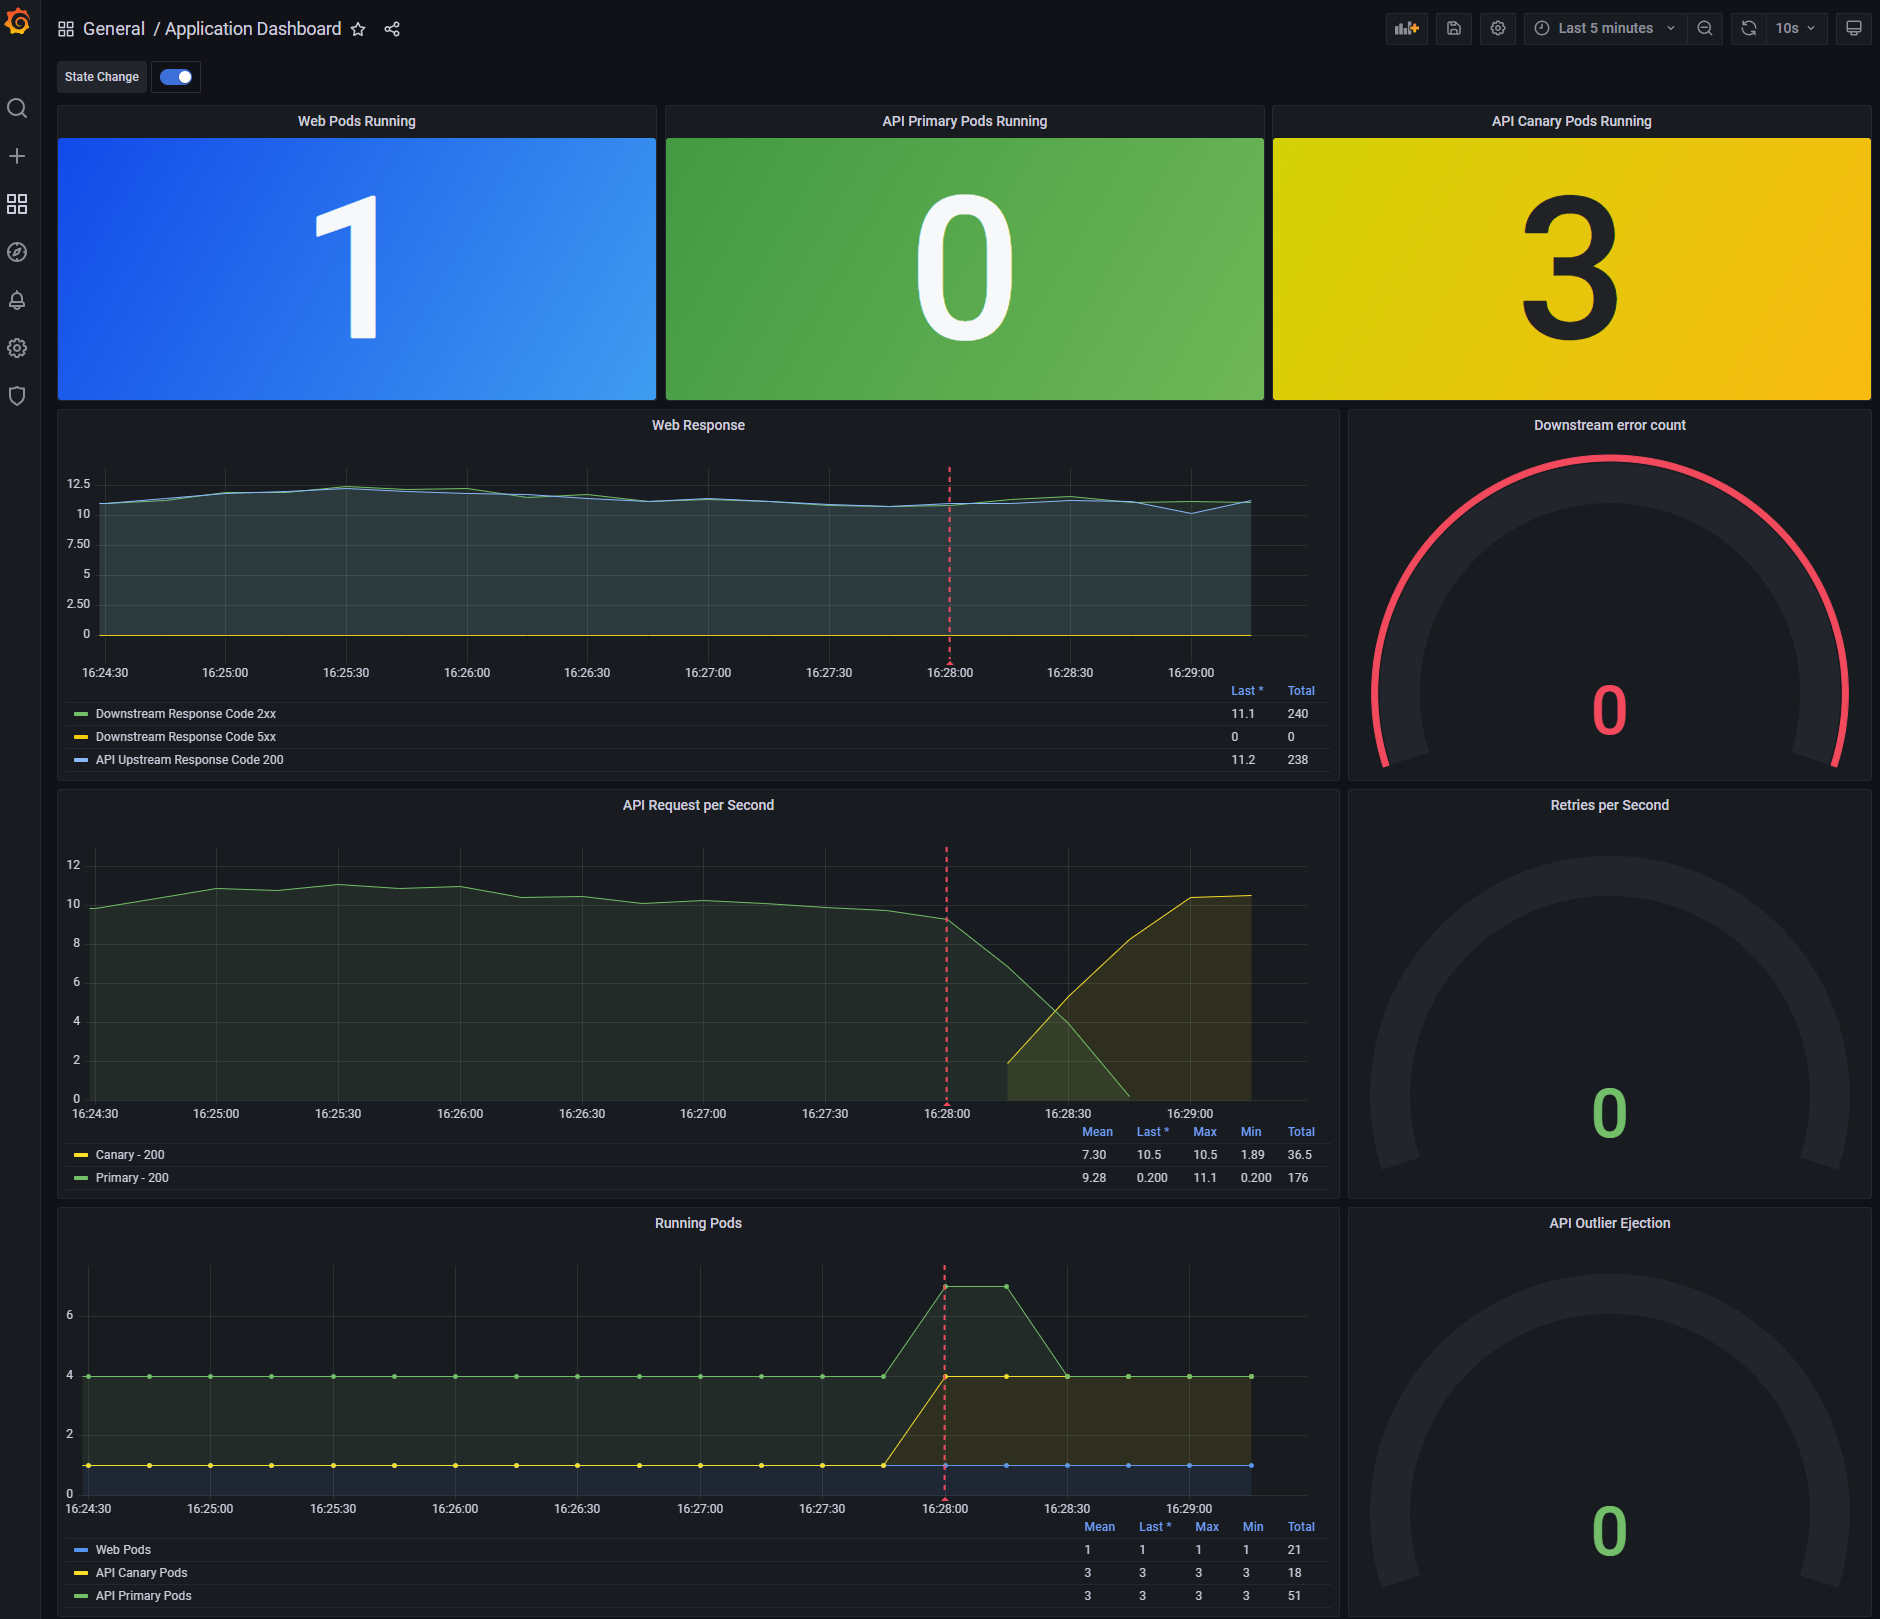
Examining the Grafana dashboard
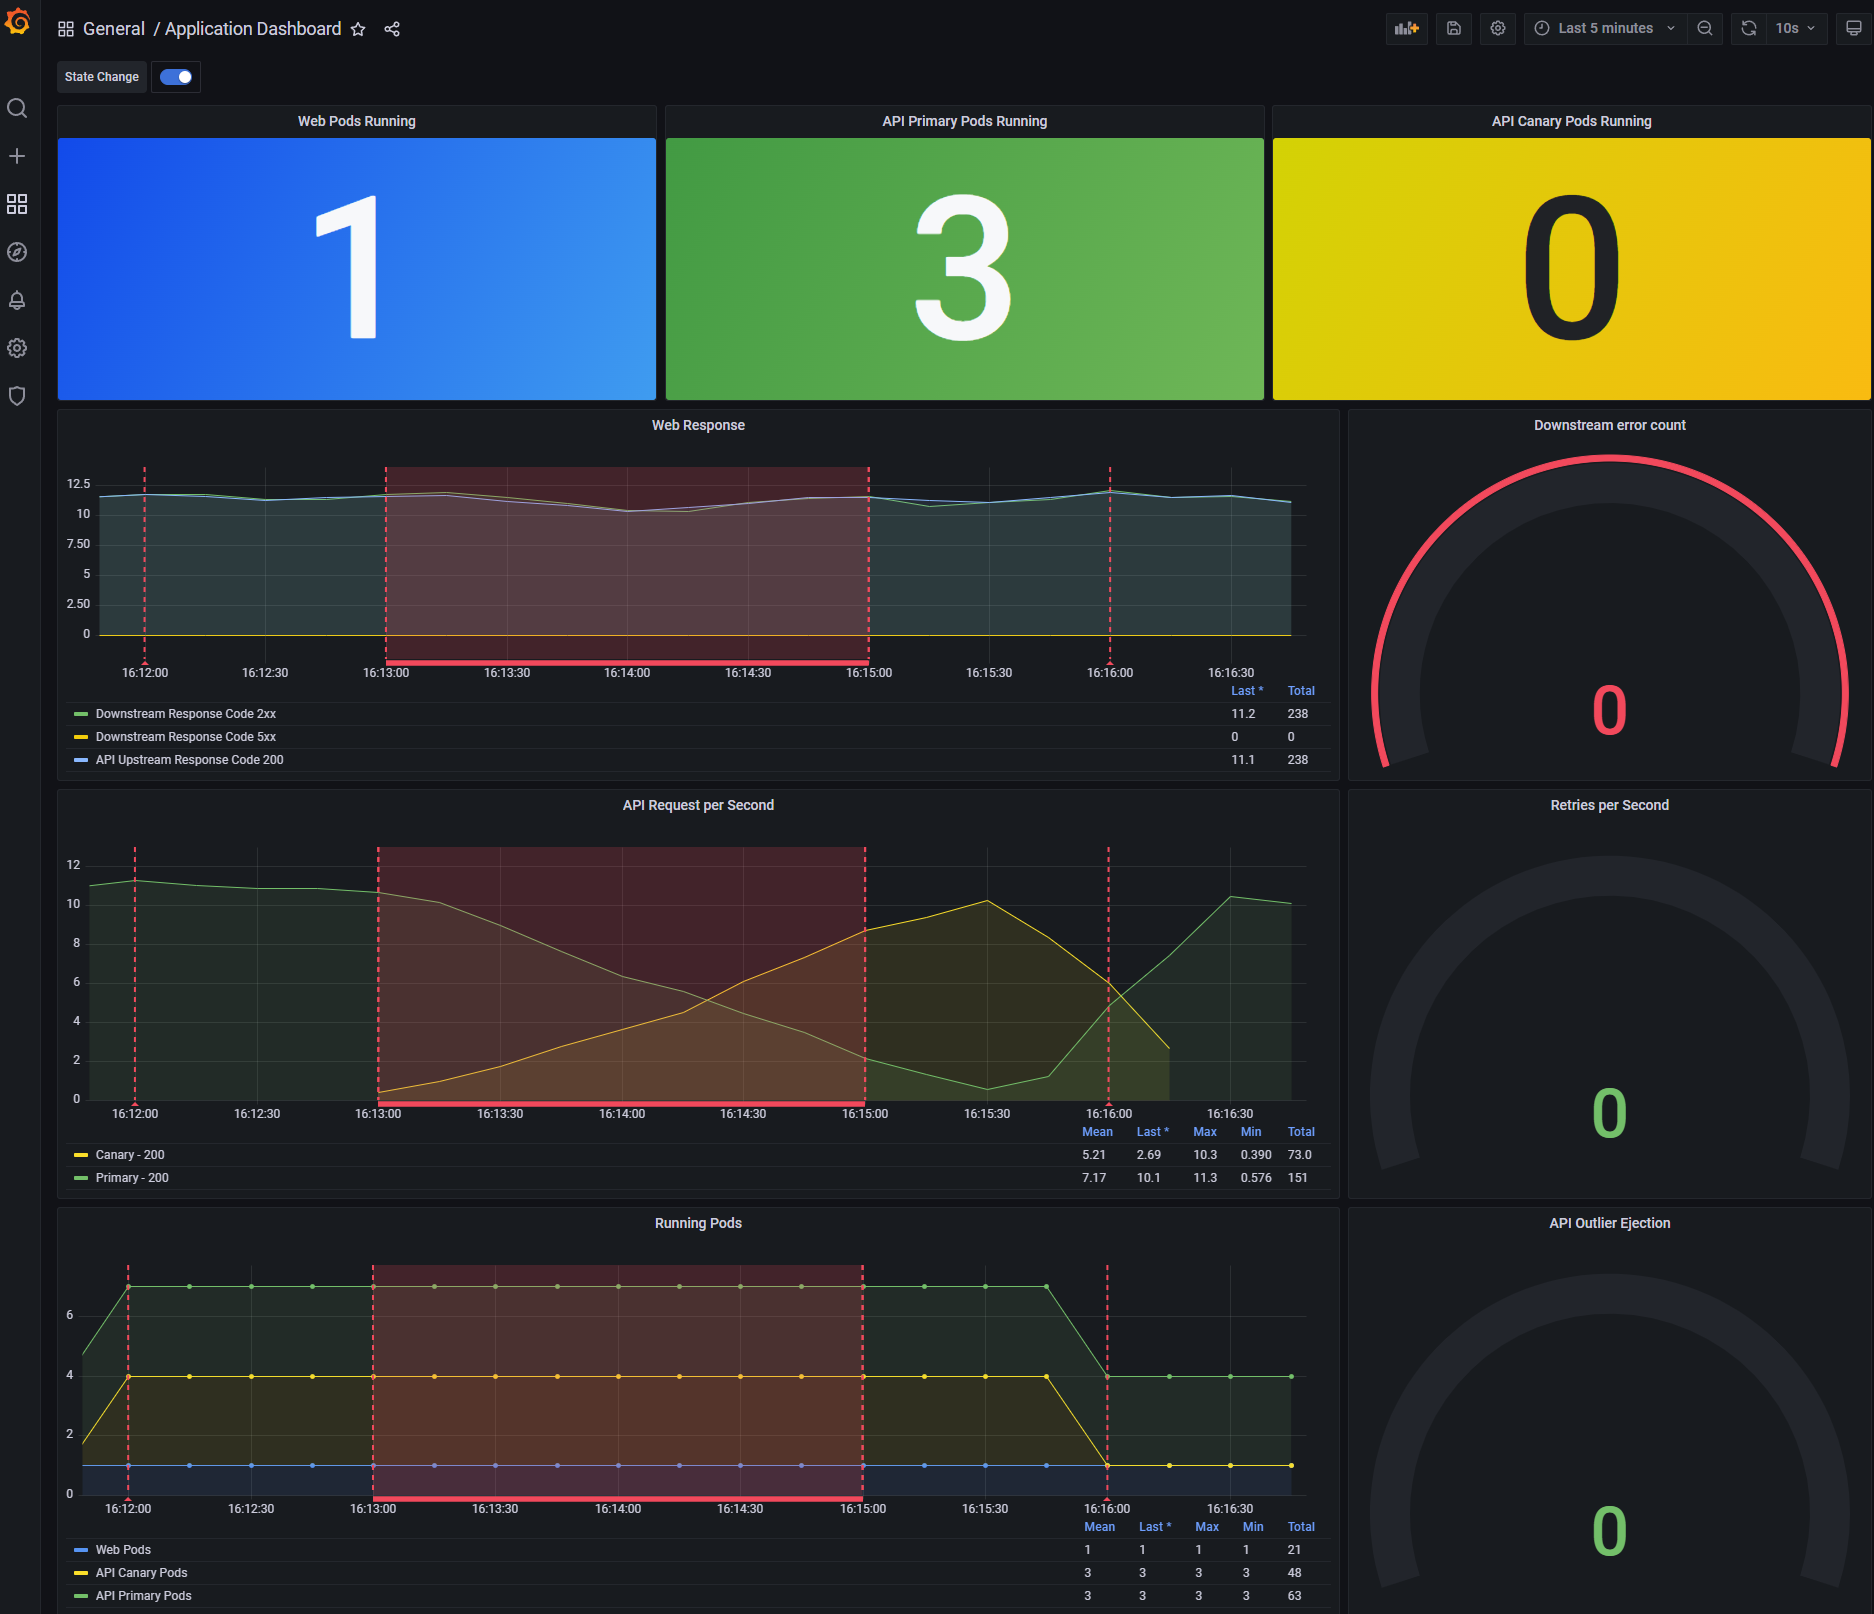
If you open the dashboard in Grafana you will see three panels at the top, this shows the number of running pods for the example app.
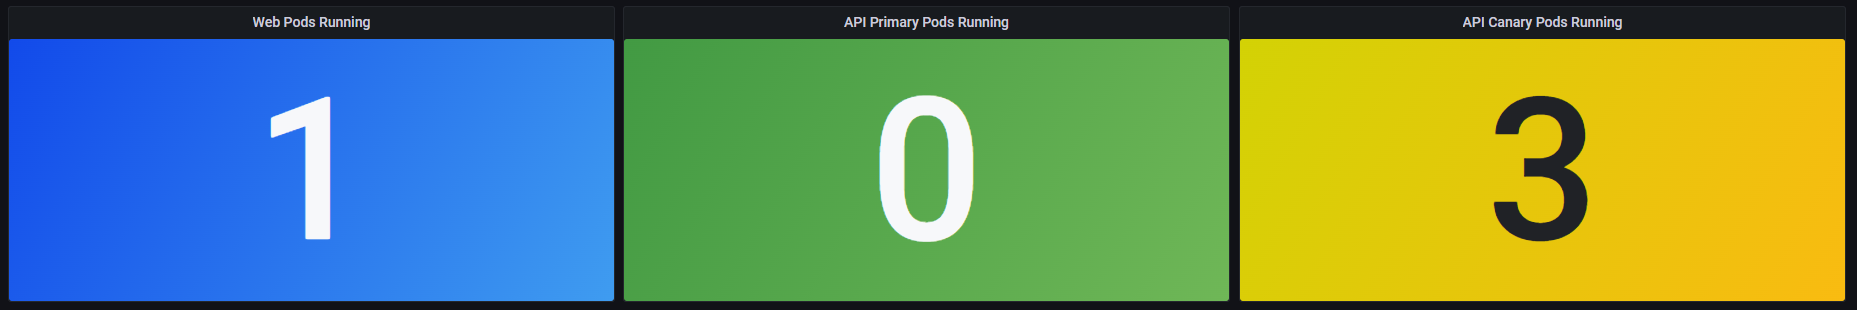
At present this should show a single Web pod and three API Canary pods, the reason for this is the way that Consul Release controller
names pods that are under it's control. When a release is created Consul Release Controller duplicates the original deployment and renames
it appending the suffix -primary. It then scales the original deployment to 0, whenever you deploy a new version of your application
Consul Release Controller treats this as the canary and will automatically control the traffic split between the primary and the canary.
Since you have not yet created a release the dashboard is showing 3 API Canary pods as this is the original deployment. You will see this
change as soon as you create a deployment.
To effectively measure the health of your release, Consul Release Controller looks at the metrics emitted from Consul Service Mesh, in a production system it is assumed that you will have constant traffic. However in the example app you have to manually generate the traffic.
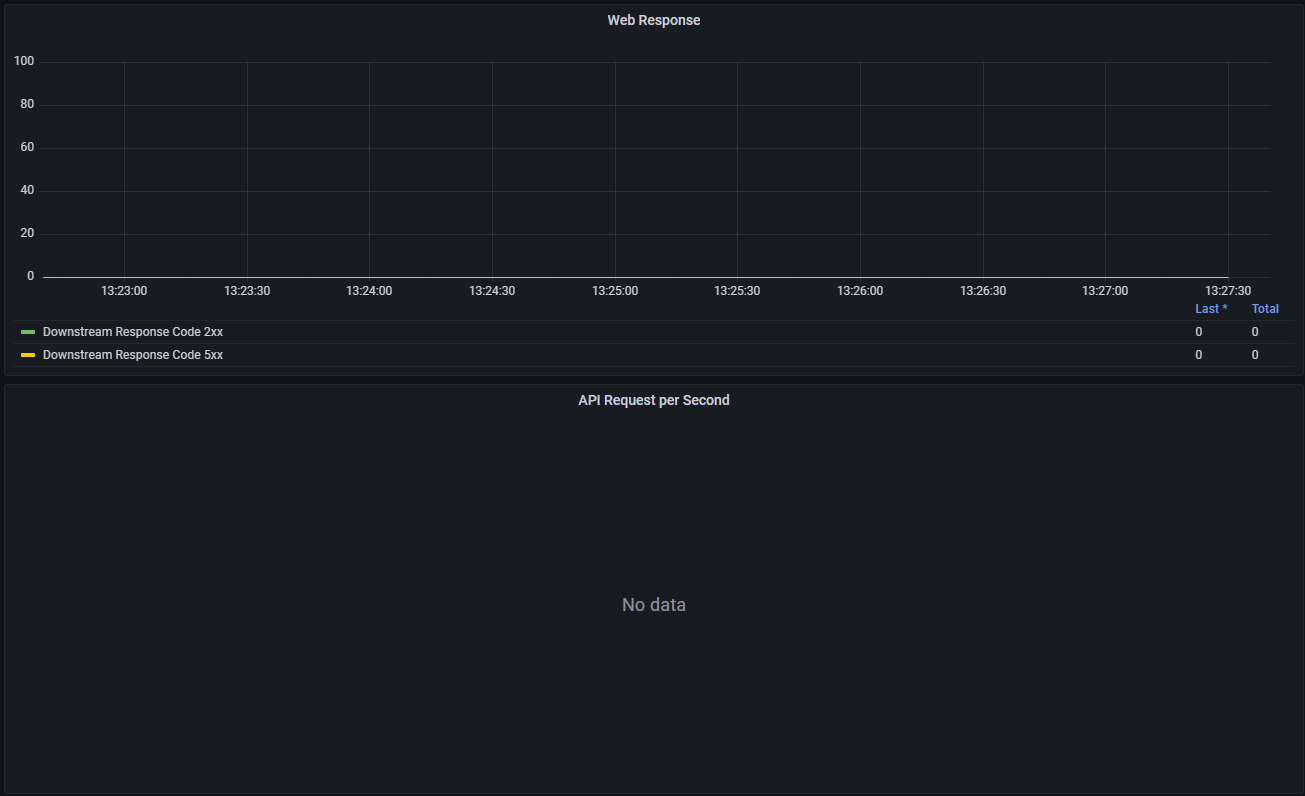
Let's see how you can deploy a simple load generation application to simulate user traffic in the example application.
Generating simulated traffic
To simulate traffic in the example application, you can deploy the loadtest.yaml configuration, this creates simulated traffic of 10 user
requests per second using k6.
Full listing for load generation loadtest.yaml
---
# Service to expose loadtest for scraping
apiVersion: v1
kind: Service
metadata:
  name: loadtest-metrics
  namespace: default
  labels:
    app: metrics
spec:
  selector:
    group: loadtest
  ports:
  - name: metrics
    protocol: TCP
    port: 9102
    targetPort: 9102

---
apiVersion: v1
kind: ConfigMap
metadata:
  name: load-generator
  namespace: default
data:
  load_test.js: |
    import http from 'k6/http';
    import { sleep, check } from 'k6';
    import { Counter } from 'k6/metrics';
    import { randomIntBetween } from 'https://jslib.k6.io/k6-utils/1.1.0/index.js';

    // A simple counter for http requests
    export const requests = new Counter('http_reqs');
    // you can specify stages of your test (ramp up/down patterns) through the options object
    // target is the number of VUs you are aiming for
    export const options = {
      vus: 10,
      duration: '30m',
    };

      //maxVUs: 10,
      //startRate: 1,
      //timeUnit: '1s',
      //stages: [
      //  { target: 1, duration: '59s' },
      //  { target: 10, duration: '120s' },
      //  { target: 10, duration: '60s' },
      //  { target: 0, duration: '1s' },
      //  { target: 0, duration: '59s' },
      //],
    export default function () {
      var payload = 'Replicants are like any other machine, are either a benefit or a hazard'
      var params = {
        headers: {
          'Content-Type': 'text/plain',
        },
      }

      // our HTTP request, note that we are saving the response to res, which can be accessed later
      const res = http.get('http://consul-ingress-gateway.consul.svc:18080');
      const checkRes = check(res, {
        'status is 200': (r) => r.status === 200,
      });

      sleep(randomIntBetween(0.2, 1.5));
    }


---
# Load test
apiVersion: apps/v1
kind: Deployment
metadata:
  name: load-generator-deployment
  labels:
    app: web
spec:
  replicas: 1
  selector:
    matchLabels:
      app: load-generator
  template:
    metadata:
      labels:
        group: loadtest
        app: load-generator
    spec:
      containers:
      - name: load-generator
        image: loadimpact/k6
        command: ["k6", "run", "--out", "statsd", "/etc/config/load_test.js"]
        env:
          - name: K6_STATSD_ADDR
            value: localhost:9125
        volumeMounts:
        - name: config-volume
          mountPath: /etc/config
      - name: statsd-exporter
        image: prom/statsd-exporter
        ports:
          - containerPort: 9102
      volumes:
        - name: config-volume
          configMap:
            name: load-generator
The load test is configured to send load to the Consul Ingress Gateway consul-ingress-gateway.consul.svc using the port 18080
if your setup uses a different port for the ingress gateway or you have installed it in a different namespace, you will need
to change the settings in loadtest.yaml before applying the configuration.
Assuming you are using the Shipyard cluster or have configured your own setup using the example settings in the prerequisites
kubectl apply \
-f https://raw.githubusercontent.com/nicholasjackson/consul-release-controller/main/example/kubernetes/loadtest.yaml
After applying the load test configuration you should start to see some activity in your Grafana dashboard.
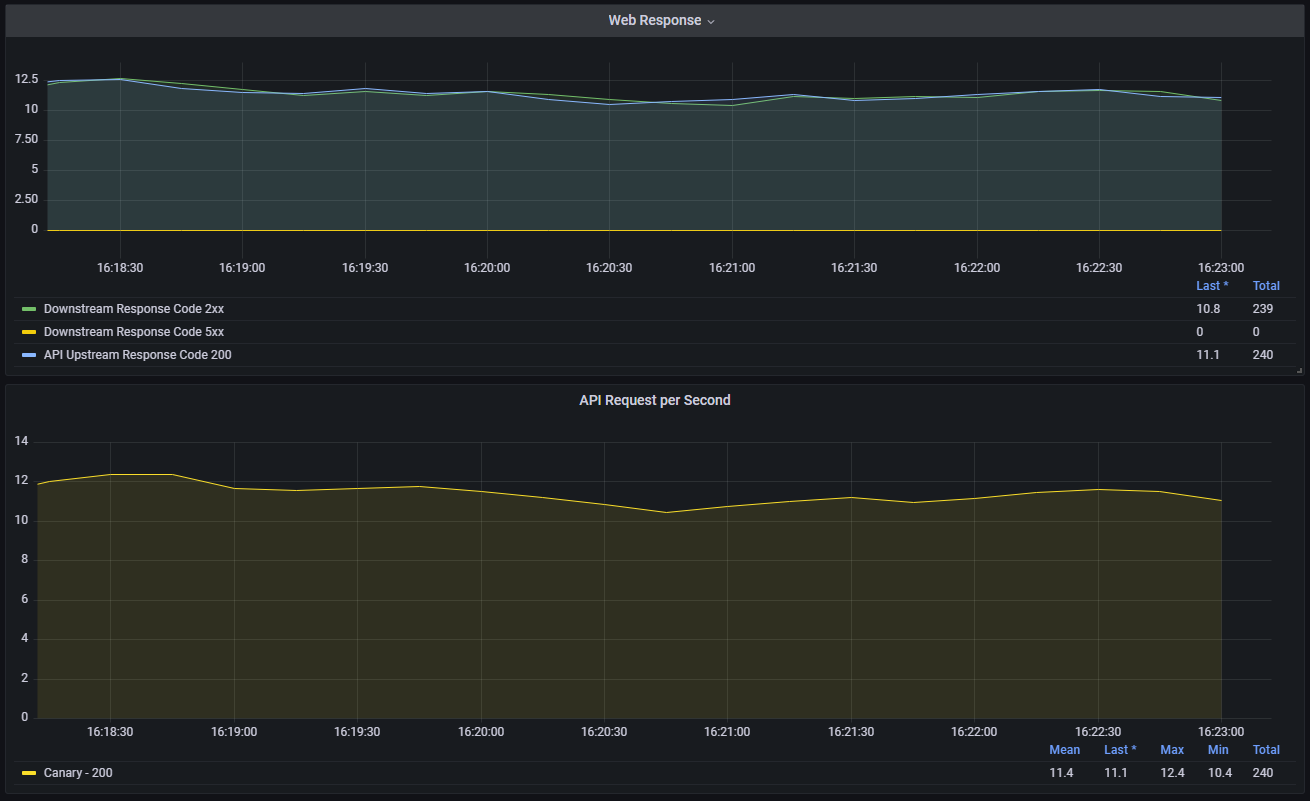
Let's now setup Consul Release Controller to monitor and perform canary releases for your API deployment.
Creating the new Release
To create a release in Kubernetes you can use the Kubernetes Release CRD, this mirrors the JSON API endpoint but
provides kubernetes user with a convenient way to create a release using kubectl.
The full details of a release looks like the following example, the spec section is broken down into sections for
each plugin that Consul Release Controller will use.
---
apiVersion: consul-release-controller.nicholasjackson.io/v1
kind: Release
metadata:
  name: api
  namespace: default
spec:
  releaser:
    pluginName: "consul"
    config:
      consulService: "api"
  runtime:
    pluginName: "kubernetes"
    config:
      deployment: "api-deployment"
  strategy:
    pluginName: "canary"
    config:
      initialDelay: "30s"
      interval: "30s"
      initialTraffic: 10
      trafficStep: 20
      maxTraffic: 100
      errorThreshold: 5
  postDeploymentTest:
    pluginName: "http"
    config:
      path: "/"
      method: "GET"
      requiredTestPasses: 3
      interval: "10s"
      timeout: "120s"
  monitor:
    pluginName: "prometheus"
    config:
      address: "http://prometheus-kube-prometheus-prometheus.monitoring.svc:9090"
      queries:
        - name: "request-success"
          preset: "envoy-request-success"
          min: 99
        - name: "request-duration"
          preset: "envoy-request-duration"
          min: 20
          max: 200
Let's break this down, section by section.
Release config
releaser
The releaser plugin is responsible for interacting with the service mesh, there is only one supported plugin
and that is consul.
config
| parameter | required | type | values | description |
|---|---|---|---|---|
| consulService | yes | string | name of the service as registered in consul service mesh | |
| namespace | no | string | Consul namespace (Enterprise only) | |
| partition | yes | string | Consul admin partition (Enterprise only) |
runtime
The runtime plugin is responsible for interacting with the platform or scheduler where the application
running, at present the only supported runtime is kubernetes, however, other runtimes are planned.
config
| parameter | required | type | values | description |
|---|---|---|---|---|
| deployment | yes | string | name of the deployment that will be managed by the controller, can also contain regular expressions, for example | |
| a deployment value of test-(.*) would match test-v1 and test-v2 |
strategy
The strategy plugin is responsible for determining how the release happens. The canary plugin will gradually
increase traffic to the new version by the amounts specified in the configuration.
config
| parameter | required | type | values | description |
|---|---|---|---|---|
| initialDelay | yes | duration | duration to wait after a new deployment before applying initial traffic | |
| initialTraffic | yes | integer | percentage of traffic to send to the canary after the initial delay | |
| interval | yes | duration | duration to wait between steps | |
| trafficStep | yes | integer | percentage of traffic to increase with each step | |
| maxTraffic | no | integer | when traffic to the canary reaches this level, the canary will be promoted to primary | |
| errorThreshold | yes | integer | number of failed health checks before the release is rolled back |
monitor
The monitor plugin is responsible for querying the health of the deployment. Consul Release Controller queries the
monitoring system like Prometheus, Datadog, Honeycomb and uses the result to decide if the strategy should progress or
if it should be rolled back.
config
| parameter | required | type | values | description |
|---|---|---|---|---|
| address | yes | string | address of the Prometheus server that should be queried | |
| queries | yes | array | queries to execute to validate the deployment |
queries
queries is an array that contains one or more queries that determine the health of the deployment. All specified
queries must be successful for the strategy to progress.
| parameter | required | type | values | description |
|---|---|---|---|---|
| name | yes | string | name of the query | |
| preset | yes | string | envoy-request-success, envoy-request-duration | preset query to execute |
| min | no | integer | minimum value that must be returned by the query for the strategy to progress | |
| max | no | integer | maximum value that must be returned by the query for the strategy to progress |
postDeploymentTest
postDeploymentTest configures tests that execute the defined request before production traffic is distributed to the
candidate deployment as part of the strategy. Should the tests fail the deployment is rolled back, if the tests
pass the roll out strategy continues.
config
| parameter | required | type | values | description |
|---|---|---|---|---|
| path | yes | string | request path for the test | |
| method | yes | string | GET,POST,DELETE,HEAD,OPTIONS,PUT | HTTP method to use for executing the tests |
| requiredTestPasses | yes | integer | number of successful responses before the test is considered a success | |
| interval | yes | duration | interval between test executions | |
| timeout | yes | duration | maximum duration for postDeploymentTest execution | |
| payload | no | string | Payload to send with POST or PUT requests |
Applying the release
Let's now create the release for the API service. If you look at the existing api pods you will see that
there are three pods with the prefix api-deployment.
➜ k get pods -l "app=api"
NAME                              READY   STATUS    RESTARTS   AGE
api-deployment-54dc89bcc9-77skf   2/2     Running   0          122m
api-deployment-54dc89bcc9-545zp   2/2     Running   0          122m
api-deployment-54dc89bcc9-bh267   2/2     Running   0          122m
These are created by the deployment api-deployment:
➜ k get deployment
NAME                        READY   UP-TO-DATE   AVAILABLE   AGE
api-deployment              3/3     3            3           123m
web-deployment              1/1     1            1           123m
load-generator-deployment   1/1     1            1           123m
When creating a new release Consul Release Controller will clone api-deployment creating a new managed deployment
api-deployment-primary, this becomes the current golden version and all production traffic is sent to it. Once the
primary deployment has been created and is healthy then the original api-deployment will be scaled to 0 pods.
Let's deploy the release and see this in action.
kubectl apply \
-f https://raw.githubusercontent.com/nicholasjackson/consul-release-controller/main/example/kubernetes/canary/api_release.yaml
Once the release has been applied you will start to see the existing api-deployment be cloned.
➜ k get pods -l "app=api"
NAME                                      READY   STATUS    RESTARTS   AGE
api-deployment-54dc89bcc9-77skf           2/2     Running   0          146m
api-deployment-54dc89bcc9-545zp           2/2     Running   0          146m
api-deployment-54dc89bcc9-bh267           2/2     Running   0          146m
api-deployment-primary-54dc89bcc9-9kwd9   1/2     Running   0          12s
api-deployment-primary-54dc89bcc9-4qwnn   1/2     Running   0          12s
api-deployment-primary-54dc89bcc9-fqmp7   1/2     Running   0          12s
Eventually you will see the original deployment be scaled to 0 and the pods removed.
➜ k get pods -l "app=api"
NAME                                      READY   STATUS    RESTARTS   AGE
api-deployment-primary-54dc89bcc9-4qwnn   2/2     Running   0          68s
api-deployment-primary-54dc89bcc9-9kwd9   2/2     Running   0          68s
api-deployment-primary-54dc89bcc9-fqmp7   2/2     Running   0          68s
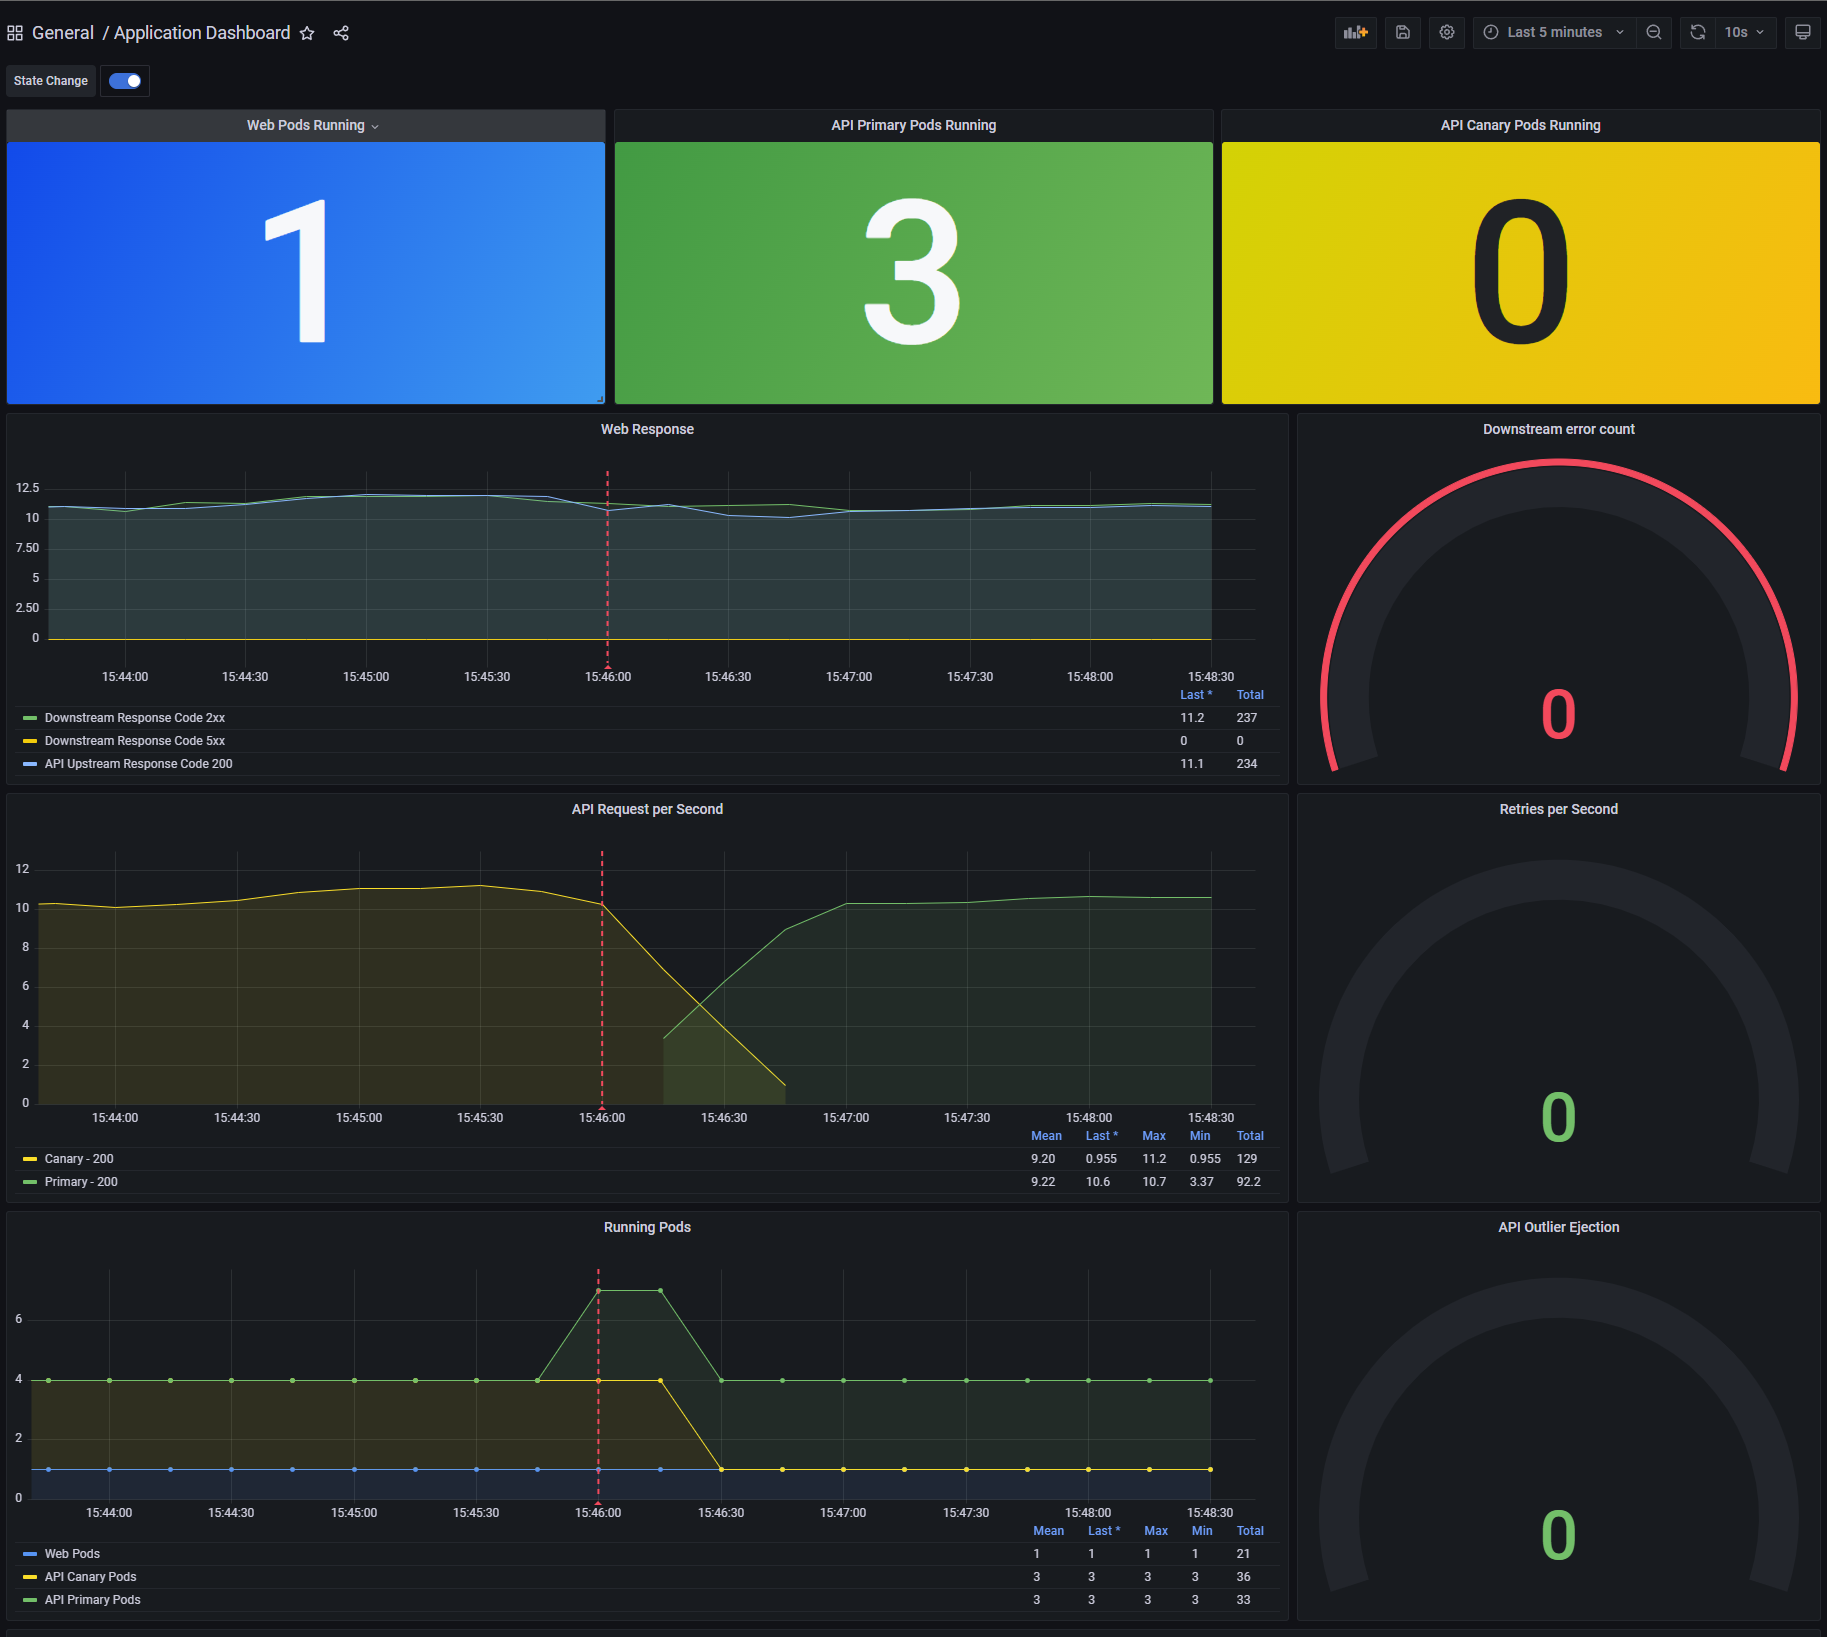
If you look at the dashboard you will also see that it is now showing 3 API Primary pods and that the API traffic
has shifted to the Primary. This is because Consul Release Controller has automatically created the necessary service
mesh configuration that is needed to configure 100% of traffic to be sent to the new Primary release.
When you next deploy a version of api-deployment, Consul Release Controller considers this the candidate and does
not initially send any traffic to the new service. Once the candidate is healthy then the strategy starts and traffic
will begin to be sent to the candidate service.
Let's created a new deployment, the new version of the deployment still uses Fake Service but has been upgraded to version 2.
Full listing for the new API deployment canary/api.yaml
---
apiVersion: apps/v1
kind: Deployment
metadata:
  name: api-deployment
  namespace: default
  labels:
    app: api_v2
spec:
  replicas: 3
  selector:
    matchLabels:
      app: api
  template:
    metadata:
      labels:
        app: api
        metrics: enabled
      annotations:
        consul.hashicorp.com/connect-inject: 'true'
        #consul.hashicorp.com/transparent-proxy: 'true'
        #consul.hashicorp.com/transparent-proxy-overwrite-probes: 'true'
    spec:
      serviceAccountName: api
      automountServiceAccountToken: true
      containers:
        - name: api
          image: nicholasjackson/fake-service:v0.22.8
          imagePullPolicy: IfNotPresent
          ports:
            - containerPort: 9090
          env:
            - name: "NAME"
              value: "API V2"
            - name: "LISTEN_ADDR"
              value: "0.0.0.0:9090"
            - name: "TIMING_50_PERCENTILE"
              value: "10ms"
            - name: "TRACING_ZIPKIN"
              value: "http://tempo:9411"
            - name: "READY_CHECK_RESPONSE_DELAY"
              value: "10s"
          readinessProbe:
            httpGet:
              path: /ready
              port: 9090
            periodSeconds: 5
            initialDelaySeconds: 5
          livenessProbe:
            httpGet:
              path: /health
              port: 9090
            periodSeconds: 5
            initialDelaySeconds: 5
Deploying a new version
Let's now deploy the new version and you will see how Consul Release Controller manages the traffic to the candidate version before promoting it as the new Primary.
kubectl apply \
-f https://raw.githubusercontent.com/nicholasjackson/consul-release-controller/main/example/kubernetes/canary/api.yaml
After you deploy the new version you will see that 6 pods are running on the cluster, 3 for the original primary and 3 of the new version.
➜ kubectl get pods -l "app=api"
NAME                                      READY   STATUS    RESTARTS   AGE
api-deployment-primary-54dc89bcc9-4qwnn   2/2     Running   0          26m
api-deployment-primary-54dc89bcc9-9kwd9   2/2     Running   0          26m
api-deployment-primary-54dc89bcc9-fqmp7   2/2     Running   0          26m
api-deployment-566478699c-p4sgh           2/2     Running   0          30s
api-deployment-566478699c-4795z           2/2     Running   0          30s
api-deployment-566478699c-r8674           2/2     Running   0          30s
Looking at the chart in Grafana, you will see the traffic slowly transition from the primary deployment to the canary. At the end of the operation, assuming the new version of your deployment remains healthy 100% of traffic will be transitioned before the primary deployment will be replaced by the canary.
At this point the release is complete and Consul Release Controller will wait for your next deployment before starting the cycle again.
Removing the release
Should you no longer wish to use Consul Release Controller to manage your deployment you remove it by deleting the release resource. Any Consul configuration that was created by Consul Release Controller will be removed and the state of the cluster will be returned to the original state.
Let's see how that works, if you run the following command to remove the API release:
kubectl delete \
-f https://raw.githubusercontent.com/nicholasjackson/consul-release-controller/main/example/kubernetes/canary/api_release.yaml
After deleting the release you will see that the original api-deployment is restored.
➜ kubectl get pods -l "app=api"
NAME                                      READY   STATUS    RESTARTS   AGE
api-deployment-primary-566478699c-qrvd7   2/2     Running   0          12m
api-deployment-primary-566478699c-qnnjl   2/2     Running   0          12m
api-deployment-primary-566478699c-ktwmf   2/2     Running   0          12m
api-deployment-779d949b6d-6x49k           2/2     Running   0          15s
api-deployment-779d949b6d-9j2lb           2/2     Running   0          15s
api-deployment-779d949b6d-6wd6j           2/2     Running   0          15s
Technically this is not the original application that existed before you created the release but a copy of the primary. Once the original deployment has been restored and is healthy, then Consul Release Controller will divert all traffic to this version before removing any configuration that was created.