Fixing Service Performance with PProf in Go
I tweeted the other day about how I managed to reduce the CPU consumption on one of my services by 90% by removing a single line of code.

One of the things I did not do, mainly since it is difficult to make a full explanation in 256 characters is explain how I identified the problem and the process I took to locate the root cause. This short post sets out to rectify that, and I hope it serves as a useful resource to save you all from repeating my embarrassing mistake.
The Service
The service I was working on was a simple API aggregation service; this exposes a public HTTP API consumed from a ReactJS website. It interacts with two other upstream services, a cache which uses gRPC for the transport and a face detection service which is using Matt Ryer and David Hernandez FaceBox.
I make no apologies for the implementation details of this service; it is not the model on an excellent microservice in fact there are components which really should be delegated out into other services. What I was building was a simple system which would allow me to demonstrate how to use the Consul Connect service mesh and Envoy’s reliability and observability features. If you would like to take a look at the source code, you can find the link on GitHub: https://github.com/emojify-app/api.
The Problem
The service itself was functioning fine, the latency was low, and there were no errors, but the CPU consumption did feel a little high for the traffic received and the work the service is doing. Running this on my Kubernetes cluster it was easy to miss this, but when running this in an environment with lower resources it was a problem as the CPU consumption was starving the other services. This unusual behavior caused me to start to take a look and investigate.
API Service CPU Consumption

The above chart is showing the CPU consumption from the service; this might be nothing normal; looking at something like CPU without context is not the best way to draw a conclusion. What started to look unusual was when I combined the CPU chart, an understanding on the actual work the service was doing at the time which was streaming files over a gRPC connection from another service, and the limited number of requests.
API Service Requests per Second
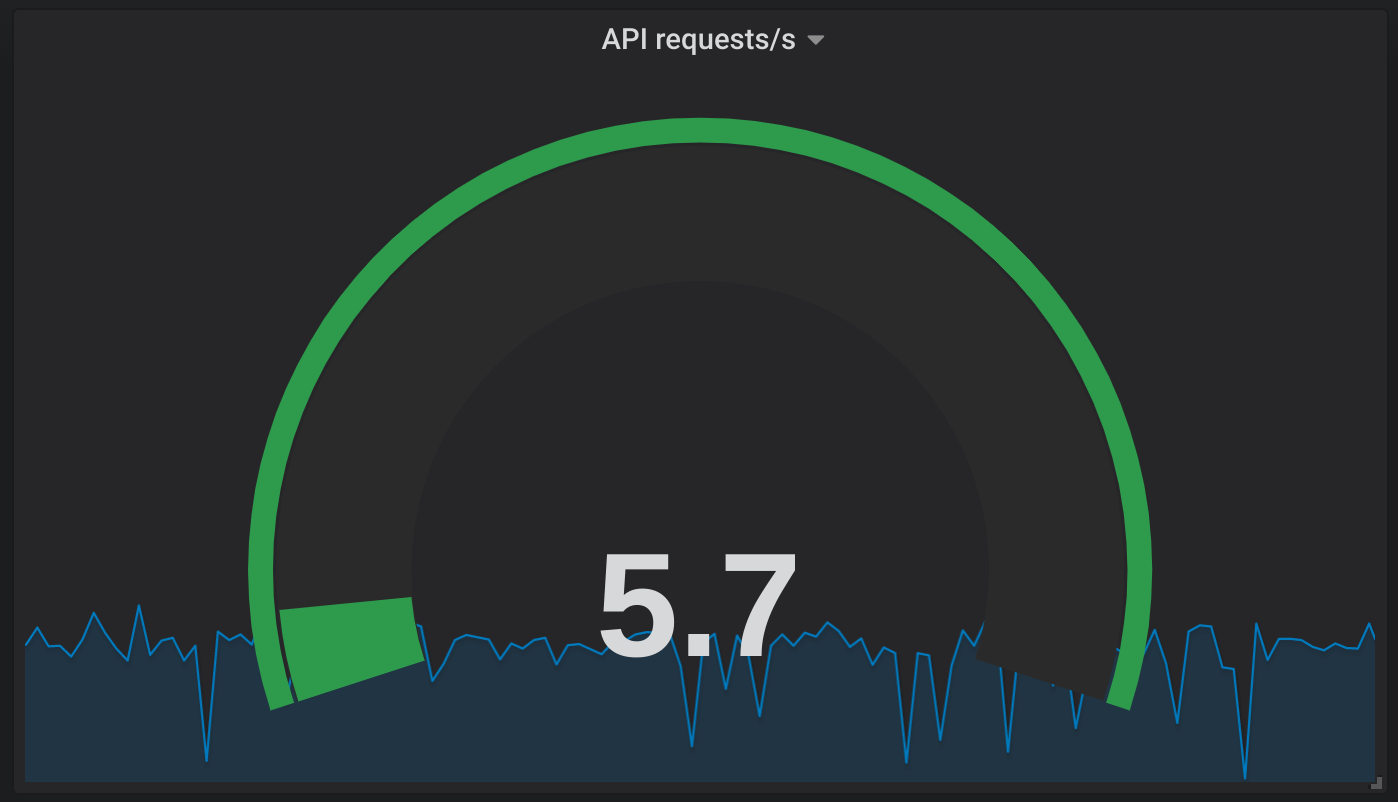
Something looks fishy here I have a hunch that there is something not quite right as I have built many Go based services and generally they are terrifically efficient on their CPU and memory consumption. Let’s take a look at the upstream that the API is calling and see how that is performing as this service is responsible for sending the files.
Cache Service CPU
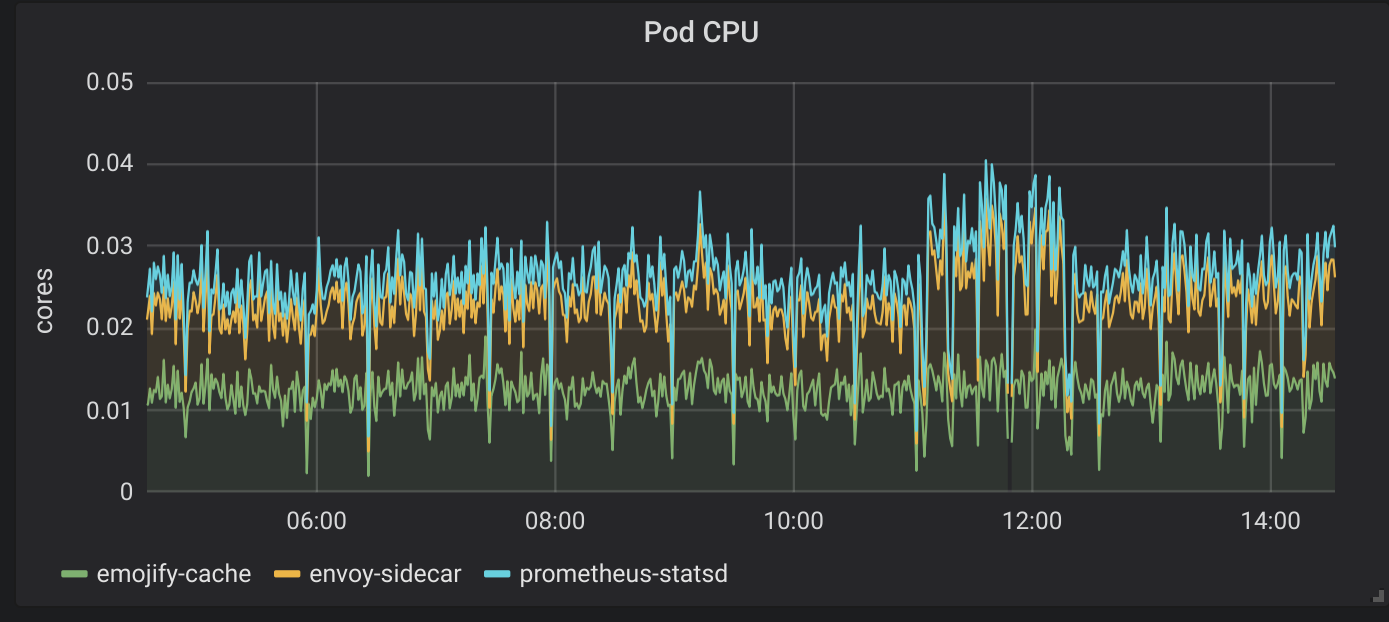
There is a dramatic difference there; the Cache is using 10% of the CPU of the API for the same number of requests. This Cache service is reading from a file and sending the bytes of data as a gRPC message. The API service receives that message and writes it as an HTTP response. There is nothing complicated going on there; there should not be such a difference in the two services.
Investigating the Problem
I was now pretty confident that there was a bug somewhere in the API service which was causing it to consume way too much CPU and I needed to investigate. Luckily for me Go has an excellent tool called pprof https://golang.org/pkg/net/http/pprof/ which allows you to inspect the internal working of your application, you can see incredible detail like timings for memory allocation and the execution time for individual blocks of code. Adding this to your code is also incredibly easy, so I decided, I would deploy a new build of my service with the diagnostics included so that I could run a profile.
To enable profiling, I only had to add a couple of lines of code; the first was to import and enable the pprof package.
import _ "net/http/pprof"
If you already have a web server in your application, then pprof automatically attaches itself to http.DefaultServeMux enables the API at the path /debug/pprof/
I was not using the DefaultServeMux in my application as I am using the Gorilla Mux package for my http handlers. Because I was using Gorilla, I had to add another line of code to enable the HTTP routing to pprof
r.PathPrefix("/debug/pprof/").Handler(http.DefaultServeMux)
After building and re-deploying my application with the instrumentation enabled I could then sample the running processes using the pprof tool. Again this is a straightforward process; the pprof has excellent documentation on how to collect the different profiles, CPU, heap, blocking, etc.
I point the pprof tool at my profile endpoint which is: https://myservice/debug/pprof/profile?seconds=5 this collects a five-second profile of the CPU. The short profile is fine for my requirements as I know the requests are completing quickly, I don’t know why they are consuming so much CPU.
$ go tool pprof "https://myservice/debug/pprof/profile?seconds=5"
Fetching profile over HTTP from https://myservice/debug/pprof/profile?seconds=5
Saved profile in /home/jacksonnic/pprof/pprof.emojify-api.samples.cpu.006.pb.gz
File: emojify-api
Type: cpu
Time: Mar 1, 2019 at 5:09am (UTC)
Duration: 5s, Total samples = 40ms (  0.8%)
Entering interactive mode (type "help" for commands, "o" for options)
(pprof)
Once I had the pprof tool running the first thing I like to do is to view a visual call trace of the collected profile, this allows me to zoom in quickly to the source of the problem. You need to have Graphviz installed to do this, but by merely executing the command pdf pprof outputs a graphical overview of the profile.
The output looked like this:
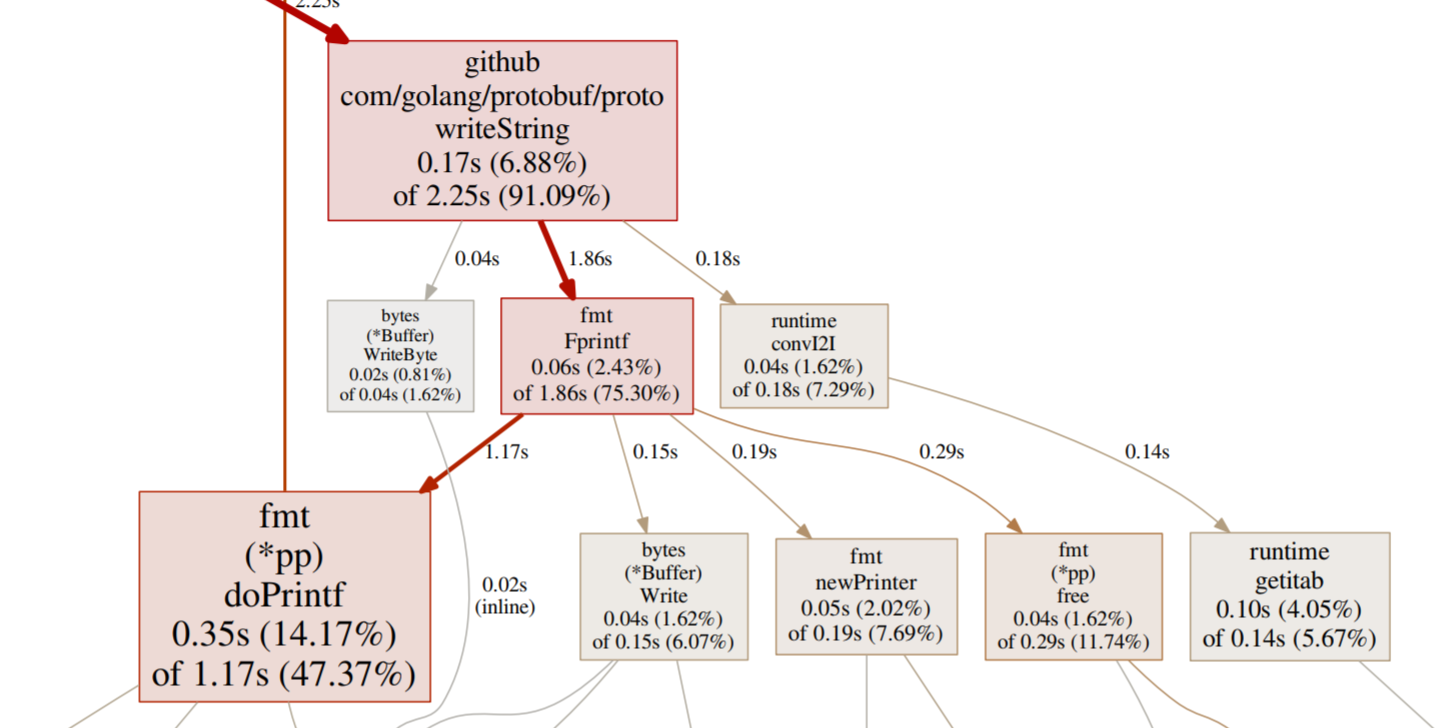
Immediately I can see that writeString in the protobuf package is consuming a considerable amount of the CPU. Next step is to trace this back up to the source, in my code to understand why.
Following the trace, I finally get to code I have written and saw this:
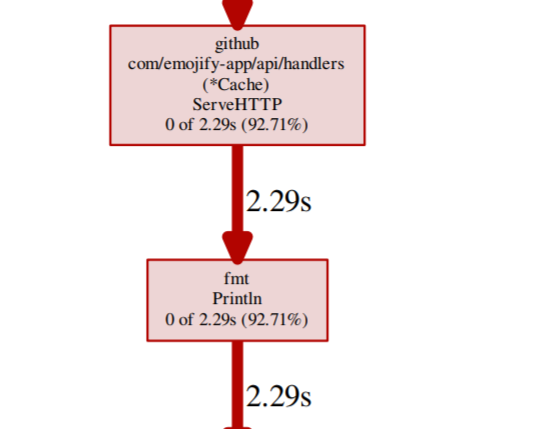
The source of the problem seems to be a fmt.Println statement, time to dig into the code and see what that is doing and why it is even there.
d, err := c.cache.Get(context.Background(), &wrappers.StringValue{Value: f})
fmt.Println("err", d, err)
So it seems that when I was debugging my application, I was writing the response from the gRPC cache service which is a protobuf message to StdOut. Like a good developer, I forgot this was there and then deployed the application. Serializing this protobuf message in this way was incredibly expensive, annoyingly it was also very unnecessary.
Fixing the Service
The fix could not be more straightforward, delete the line of code, rebuild and deploy the service again, with the new service deployed there was an immediate impact to the CPU consumption.
CPU post fix
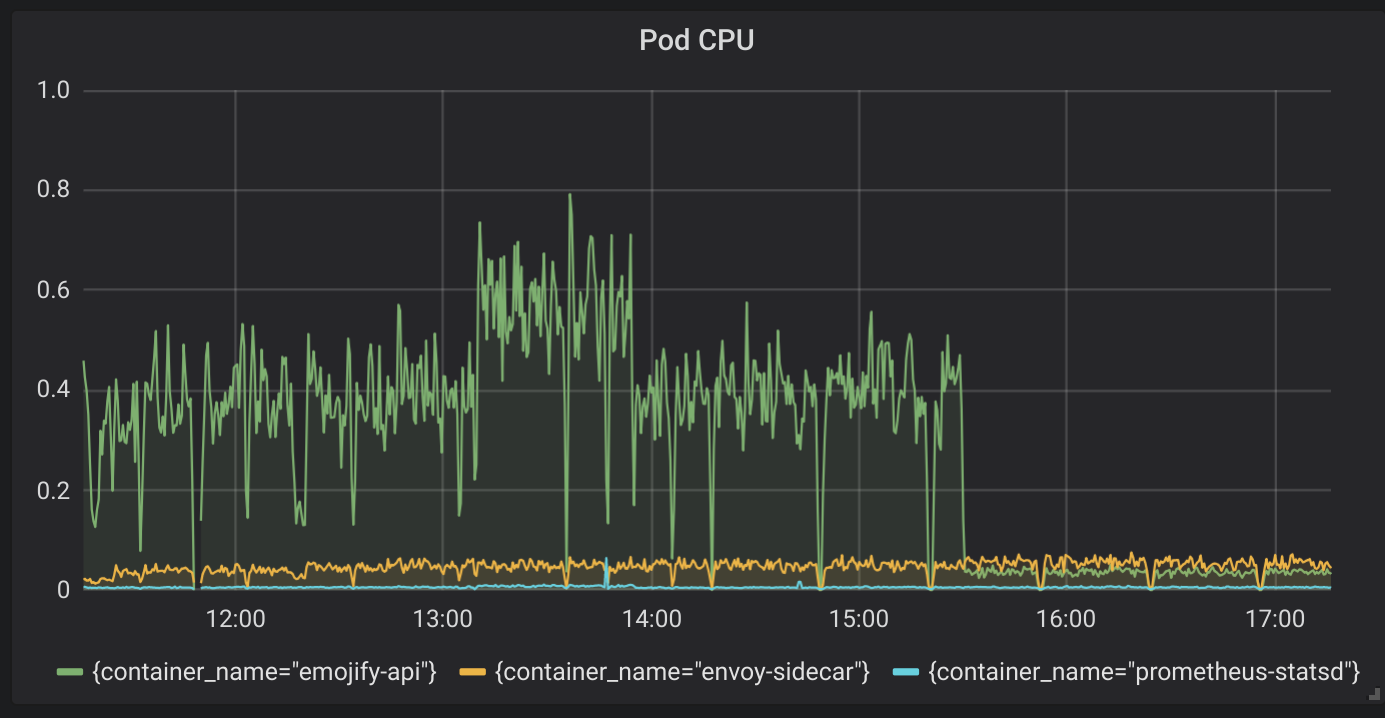
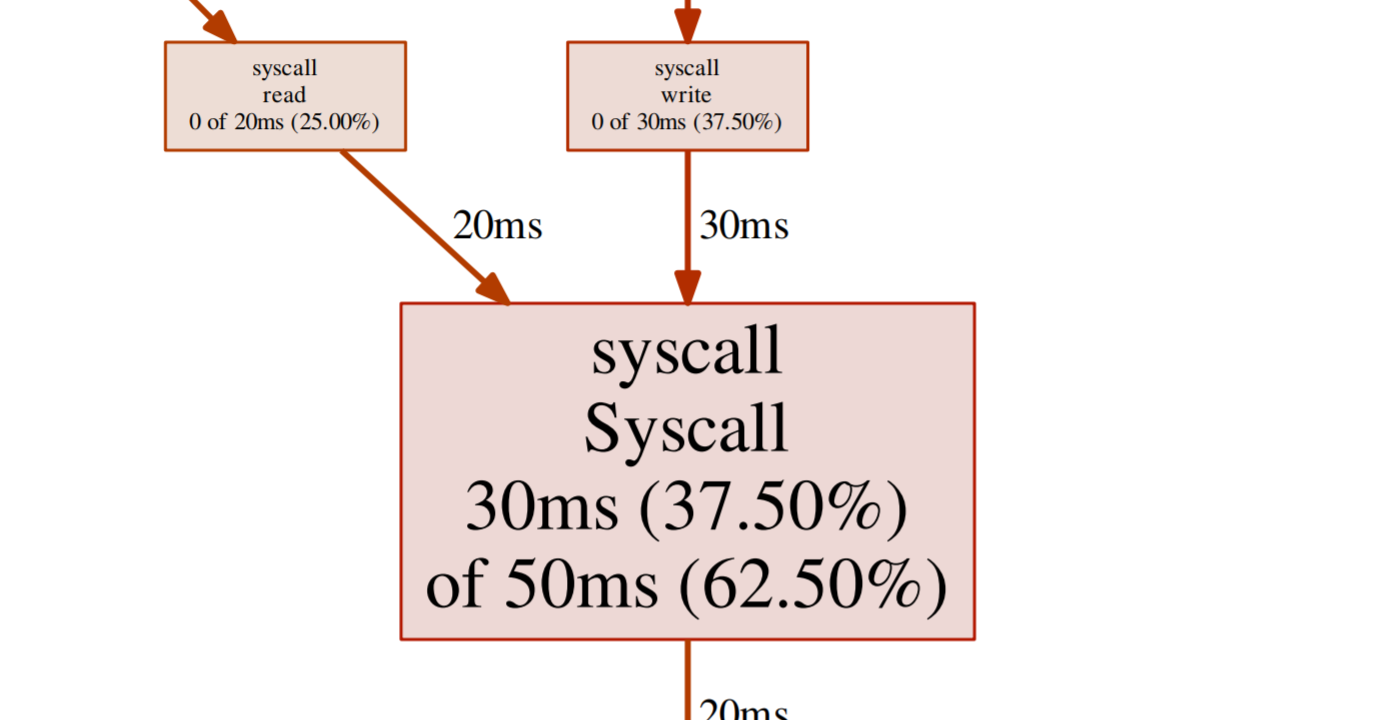
Over a 90% reduction in CPU, and what looks like far more normal operating conditions for the service with this traffic. It is good to double check; however, so again I ran a profile, this time the profile showed the hot spot as syscall. The result this time is what I would expect as the service is mainly reading and writing to a TCP socket.
CPU profile after fix
Summary
I always say no experience is bad if you can learn something from it, I certainly learned that I am prone to making stupid mistakes, but it was also fun to dig into pprof again. The whole process of finding the problem and fixing it took me approximately 30 minutes, this, of course, could have been so much longer had the issue not been so pronounced. However, it highlights just how amazing the tooling in the Go ecosystem is.
If you want a takeaway, I have two:
- Code review, a fresh pair of eyes would probably spot the unnecessary
Printlnstatement - Profile your services before major deployments, it does not take long, and a quick eyeball of the results can save embarrassing mistakes
If you would like to see more detail on the before and after traces, you can download a PDF from the following links:
- Before: profile001.pdf
- After: profile002.pdf
One final thing, remember to remove the instrumentation from your service, especially if this is running in production. I may or may not have just done this.
Have fun,
Nic